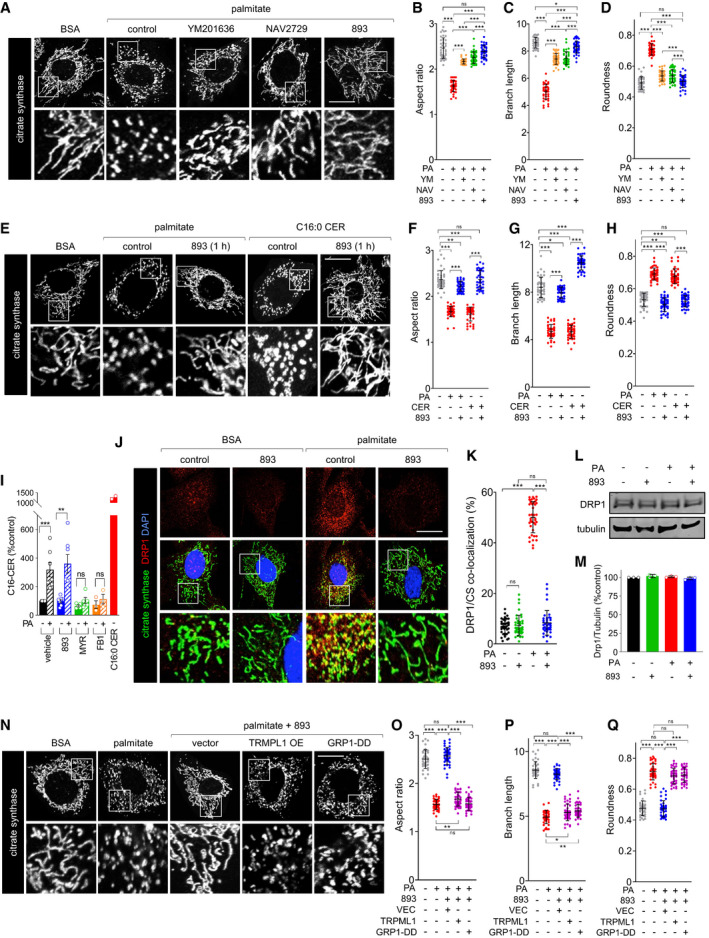
Figure 1. SH‐BC‐893 protects from ceramide‐induced mitochondrial network fragmentation by disrupting intracellular trafficking.

-
ACitrate synthase staining in MEFs treated for 3 h with BSA or palmitate (250 μM) after a 3‐h pre‐treatment with DMSO (control), YM201636 (YM, 800 nM), NAV2729 (NAV, 12.5 μM), or SH‐BC‐893 (893, 5 μM).
- B–D
-
EMEFs were treated with BSA, palmitate (250 μM), or C16:0 CER (100 μM) for 3 h after a 1‐h pre‐treatment with vehicle or SH‐BC‐893 (5 μM) and mitochondria stained as in (A).
-
F–HAspect ratio (F), branch length (G), and roundness (H) of mitochondria in the cells in (E).
-
IMean C16:0 ceramide levels in MEFs pre‐treated for 3 h with vehicle (n = 7), SH‐BC‐893 (5 μM, n = 7), myriocin (myr, 10 μM, n = 5), or fumonisin B1 (FB1, 30 μM, n = 3) then treated with BSA or palmitate (250 μM) for 3 h. Cells treated with C16:0 CER (100 μM, n = 2) for 3 h shown as a positive control. Error bars, SEM.
-
JMEFs treated as in (A) but evaluated for DRP1 (red) and citrate synthase (green) co‐localization (yellow) using confocal immunofluorescence microscopy. Nuclei are labeled with DAPI (blue).
-
KMander’s overlap coefficient for DRP1 and citrate synthase (CS) for the cells in (J) calculated on a per cell basis.
-
L, MRepresentative DRP1 Western blot (L) or quantification of DRP1 levels (M) using cells treated as in (J); n = 3. Mean ± SD.
-
NMEFs expressing vector, TRPML1, or GRP1‐DD were treated with BSA or palmitate (250 μM) for 3 h and stained as in (A).
-
O–QAspect ratio (O), branch length (P), and roundness (Q) of mitochondria in the cells in (N).
Data information: In B‐D, F‐H, K, and O‐Q, 40 cells from 2 biological replicates were evaluated and mean ± SD shown. Using a one‐way ANOVA with Tukey’s correction (C, D, H, M, P and Q), Brown‐Forsythe and Welch ANOVA tests with Dunnett’s correction for multiple comparisons (B, F, G, K and O), or unpaired, two‐tailed t‐tests (I), ***P ≤ 0.001; **P ≤ 0.01; *P ≤ 0.05; ns, not significant, P > 0.05 (key comparisons shown). Scale bars, 20 µm.
