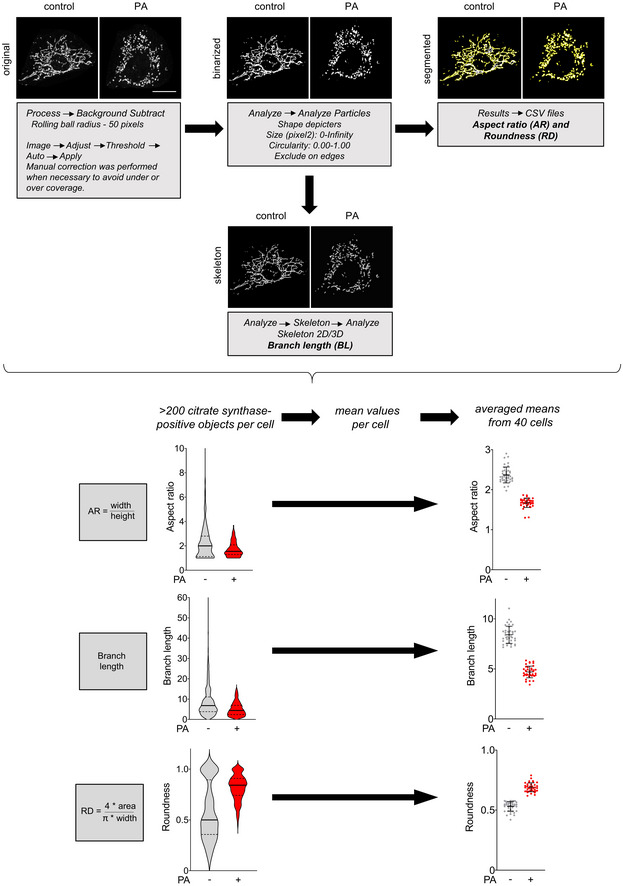
Figure EV1. Strategy for morphometric analysis of mitochondrial networks in vitro.

Representative images of citrate synthase staining in MEFs treated with vehicle (left panels) or palmitate (PA, right panels). Images are maximum intensity Z‐projections derived from 8 Z‐slices. Binarized mitochondrial networks were segmented to tag individual objects. Aspect ratio (tubule width/length) as well as roundness ((4 × area)/(π × width)) were measured for all citrate synthase‐positive objects on a per cell basis. Skeletonized networks were used to quantify branch length of the tubules. Violin plots show all citrate positive objects in the representative cell (left); the center line is the median and the quartiles define the 25th to 75th percentile. The scatter plots show mean ± SD from 40 cells from 2 biological replicates. Scale bar, 20 µm.
