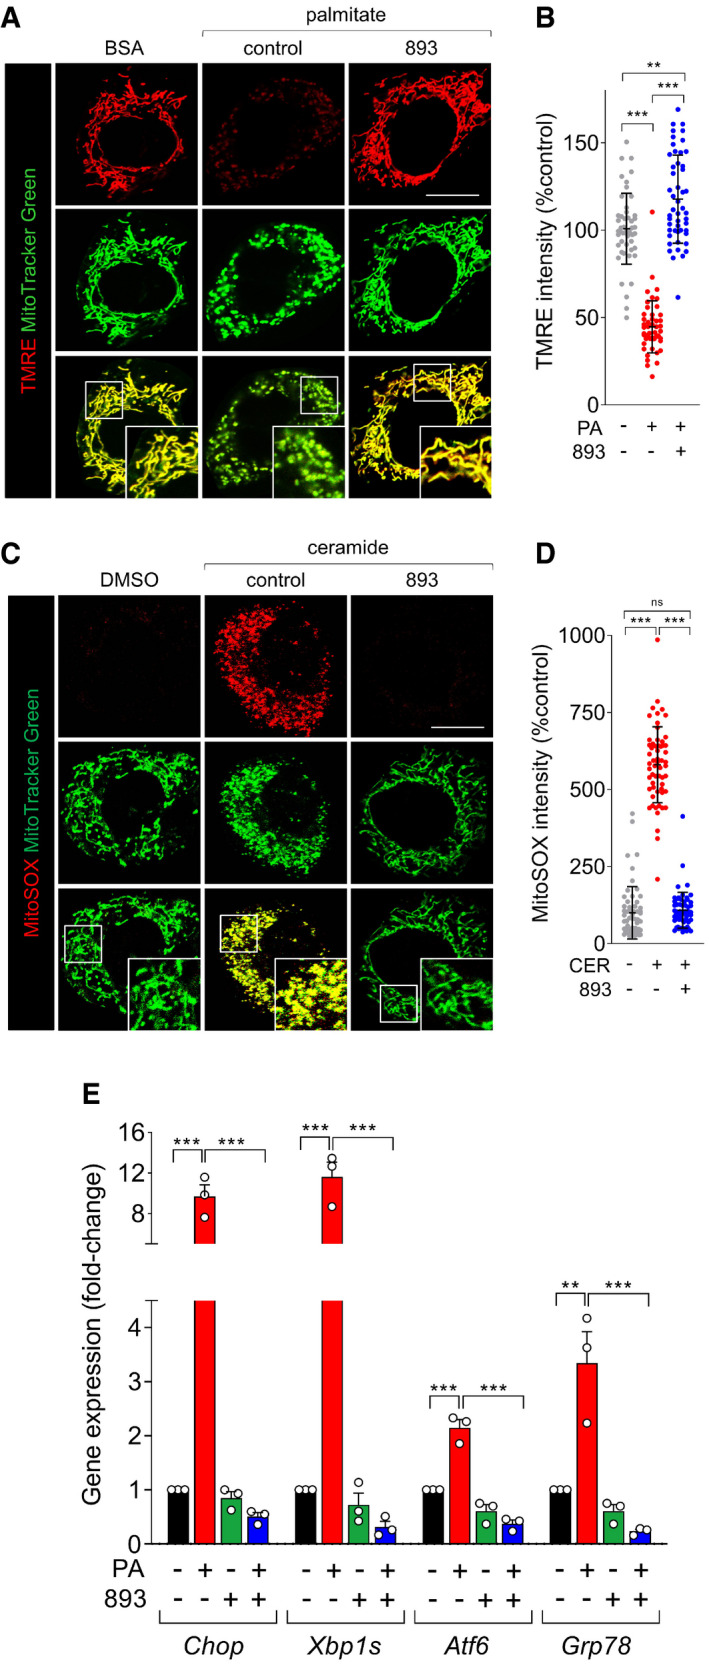
Figure 2. SH‐BC‐893 protects from ceramide‐induced mitochondrial dysfunction.

- TMRE (100 nM) and MitoTracker Green (200 nM) staining in MEFs treated with BSA or palmitate (250 μM) for 12 h after a 3‐h pre‐treatment with vehicle or SH‐BC‐893 (893, 5 μM).
- TMRE intensity in (A) on a per cell basis.
- MitoSOX (5 μM) and MitoTracker Green (200 nM) staining in MEFs treated with vehicle (DMSO) or C2‐ceramide (50 μM) for 12 h after a 3‐h pre‐treatment with vehicle or SH‐BC‐893 (893, 5 μM).
- MitoSOX intensity for (C) on a per cell basis.
- Chop, Xbp1s, Atf6, and Grp78 mRNA levels measured in MEFs treated for 16 h with BSA or palmitate (250 μM) after a 3‐h pre‐treatment with vehicle or SH‐BC‐893 (893, 5 μM); n = 3. Mean ± SEM.
Data information: In B and D, 50‐60 cells from 2 biological replicates were evaluated and mean ± SD shown. Using Brown–Forsythe and Welch ANOVA tests with Dunnett’s correction (B, D) or a one‐way ANOVA with Tukey’s correction for multiple comparisons (E), ***P ≤ 0.001; **P ≤ 0.01; ns, not significant, P > 0.05 (key comparisons shown). Scale bars, 20 µm.
