
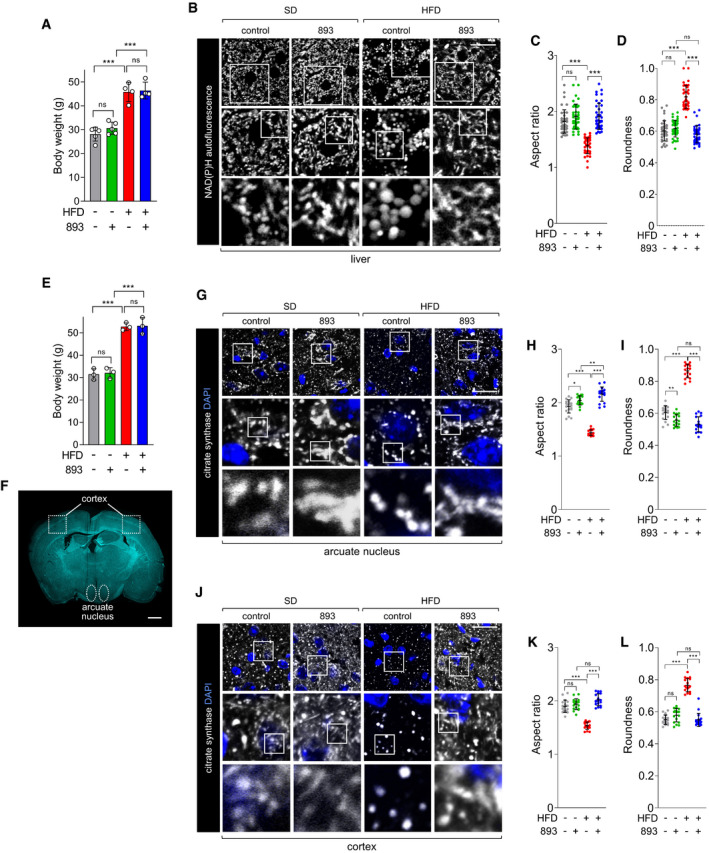
Figure 3. SH‐BC‐893 acutely restores a tubular mitochondrial network in the liver and brain of HFD‐fed mice.
-
ABody weights of mice that had consumed a SD for 22 weeks or a HFD for 26 weeks; n = 4–5. Mean ± SD. Mice are grouped to reflect their randomization to vehicle or SH‐BC‐893 groups, weight measured prior to treatment.
-
BNAD(P)H autofluorescence evaluated by confocal microscopy in freshly resected livers from mice in (A) 4–8 h after treatment with vehicle (n = 5) or 120 mg/kg SH‐BC‐893 (n = 4) by gavage at ZT8.5. Mice were sacrificed and imaged in pairs (SD and HFD).
-
C, DAspect ratio (C) and roundness (D) of mitochondria in the livers shown in (B) calculated per field as described in Fig EV3; 40 fields examined from each treatment group.
-
EBody weights of mice that had consumed a chow or HFD diet for 22 weeks; n = 3. Mean ± SD. Mice are grouped to reflect their randomization to vehicle or SH‐BC‐893 groups, weight measured prior to treatment.
-
FCoronal brain section showing the areas where mitochondria were imaged in G‐L.
-
GCitrate synthase staining in the arcuate nucleus of mice in (E) 4 h after treatment with vehicle or 120 mg/kg SH‐BC‐893 by gavage at ZT8.5; n = 3.
-
H, IAspect ratio (H) or roundness (I) of the mitochondria in (G); 18 fields examined from each treatment group.
-
J–LAs in G‐I, but imaging was performed in the areas of the cortex outlined in (F). 18 fields examined from each treatment group.
Data information: In A, C, D, E, H, I, K and L mean ± SD shown; 8‐12 (C, D) or 6 (H, I, K and L) fields evaluated per mouse. Using a one‐way ANOVA with Tukey’s correction for multiple comparisons, ***P ≤ 0.001; **P ≤ 0.01; *P ≤ 0.05; ns, not significant, P > 0.05 (key comparisons shown). Scale bars, 20 µm (B, G, and J) or 1 mm (F).