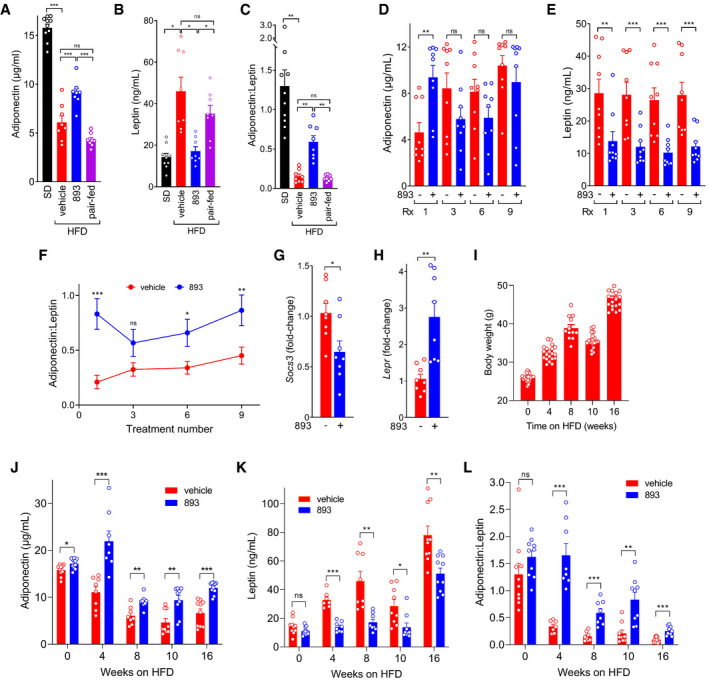
Figure 5. SH‐BC‐893 normalizes adipokine levels in mice consuming a HFD.

-
A, BPlasma adiponectin (A) or leptin (B) in mice maintained on a SD or HFD for 8–9 weeks and then gavaged with vehicle or 120 mg/kg SH‐BC‐893 4 h prior to blood collection. Pair‐fed mice were provided with the amount of food consumed by SH‐BC‐893‐treated mice in 4 h but left untreated; n = 8–10.
-
CThe adiponectin:leptin ratio was calculated for the mice in A, B.
-
D, EAs in (A, B) but in mice maintained on the HFD for 10 weeks and then gavaged Mondays, Wednesdays, and Fridays for 3 weeks with vehicle or 120 mg/kg SH‐BC‐893; n = 9. Rx, treatment number of a total of nine doses.
-
FThe adiponectin:leptin ratio was calculated for the mice in (D, E); n = 9.
-
G, HMice were treated as in D‐F, sacrificed 4 h after the ninth dose, and the levels of Socs3 (G) or Lepr (H) mRNA measured in the hypothalamus; n = 8.
-
IBody weights of mice fed the HFD for the indicated interval. Two cohorts were utilized: one measured at 4 and 8 wk and the other at 10 and 16 weeks; n = 16–20.
-
J, KPlasma adiponectin and leptin were measured in the mice in (I) 4 h after a single dose of 120 mg/kg SH‐BC‐893; n = 7–10.
-
LThe adiponectin:leptin ratio was calculated for the mice in J,K; n = 7–10.
Data information: Mean ± SEM shown. Using a one‐way ANOVA with Tukey’s correction (A), Brown–Forsythe and Welch ANOVA tests with Dunnett’s correction for multiple comparisons (B, C), or unpaired two‐tailed t‐tests (D‐H and J‐L, Welch’s correction applied in H), ***P ≤ 0.001; **P ≤ 0.01; *P ≤ 0.05; ns, not significant, P > 0.05.
