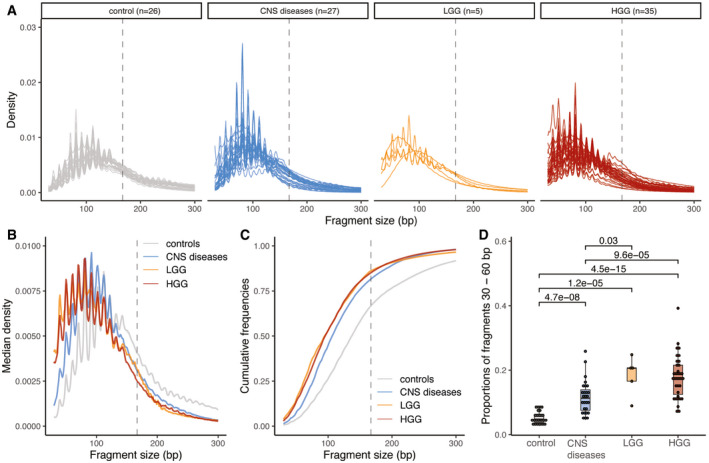
Figure 5. cfDNA fragmentation patterns are altered in the urine of HGG and LGG patients when compared to healthy controls and other CNS diseases.

- Size distribution of urine cfDNA fragments determined from paired‐end sWGS (< 1× coverage) of 26 healthy controls (in gray), 27 patients with other CNS diseases (cerebral aneurysm, and myeloneuropathy, in blue), five patients with LGG (in orange), and 30 HGG patients (35 samples, in red). Samples from LGG and HGG patients were collected at baseline.
- Median size distribution of urine cfDNA fragments determined from paired‐end sWGS (< 1× coverage) for the different patients included in this study (median for each of the groups in part A).
- Median of the cumulative distribution function of the urine cfDNA fragment sizes of the patients included in this study.
- Proportion of fragment sizes between 30 and 60 bp in the urine of cfDNA from healthy controls (gray), other non‐cancer CNS pathologies (light blue), LGG (orange), and HGG (red). Wilcoxson‐test comparing the boxplots are added. Horizontal line within the bars represents median of the underlying population. Boxplot whiskers show 1.5 interquartile range of highest and lowest quartile.
