
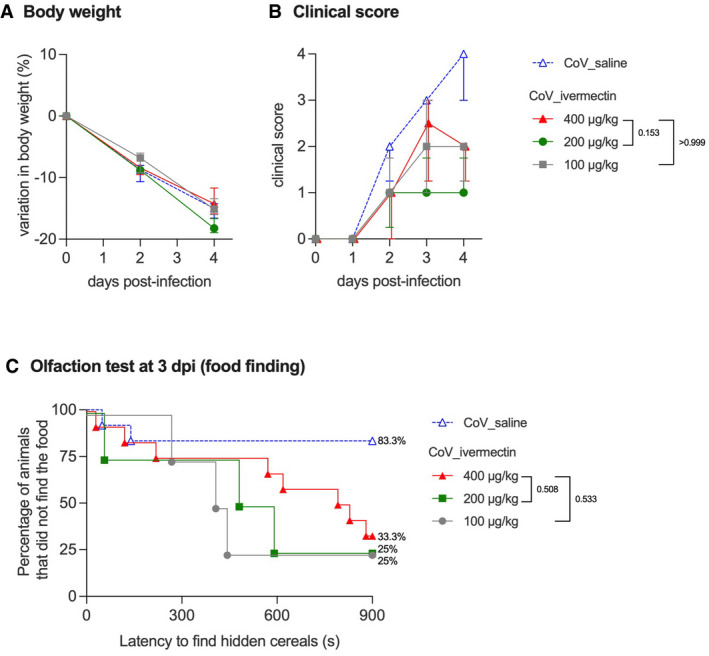
Figure EV2. Clinical aspects of SARS‐CoV‐2‐infected male hamsters and treated with different doses of ivermectin.
-
AProgression of body weight in male hamsters, treated with saline or with 400, 200, or 100 µg/kg ivermectin. Symbols indicate the median ± interquartile range.
-
BClinical score based on a cumulative 0–4 scale: ruffled fur; slow movements; apathy; and absence of exploration activity. Symbols indicate the median ± interquartile range.
-
COlfaction deficit based on the buried food finding test. Curves represent the percentage of animals that did not find the buried food. Food finding assays were performed at 3 days post‐infection.
Data information: n = 12/group (CoV_saline and CoV_ivermectin 400 µg/kg, as shown in Fig 1) or n = 4 (CoV_ivermectin 200 µg/kg and 100 µg/kg). The P value is indicated in bold when significant at a 0.05 threshold. Mann–Whitney test at 4 dpi (B) and log‐rank (Mantel–Cox) test (C). The data for CoV_saline and CoV_ivermectin 400 µg/kg groups (B, C) are already presented in Fig 1B.
Source data are available online for this figure.