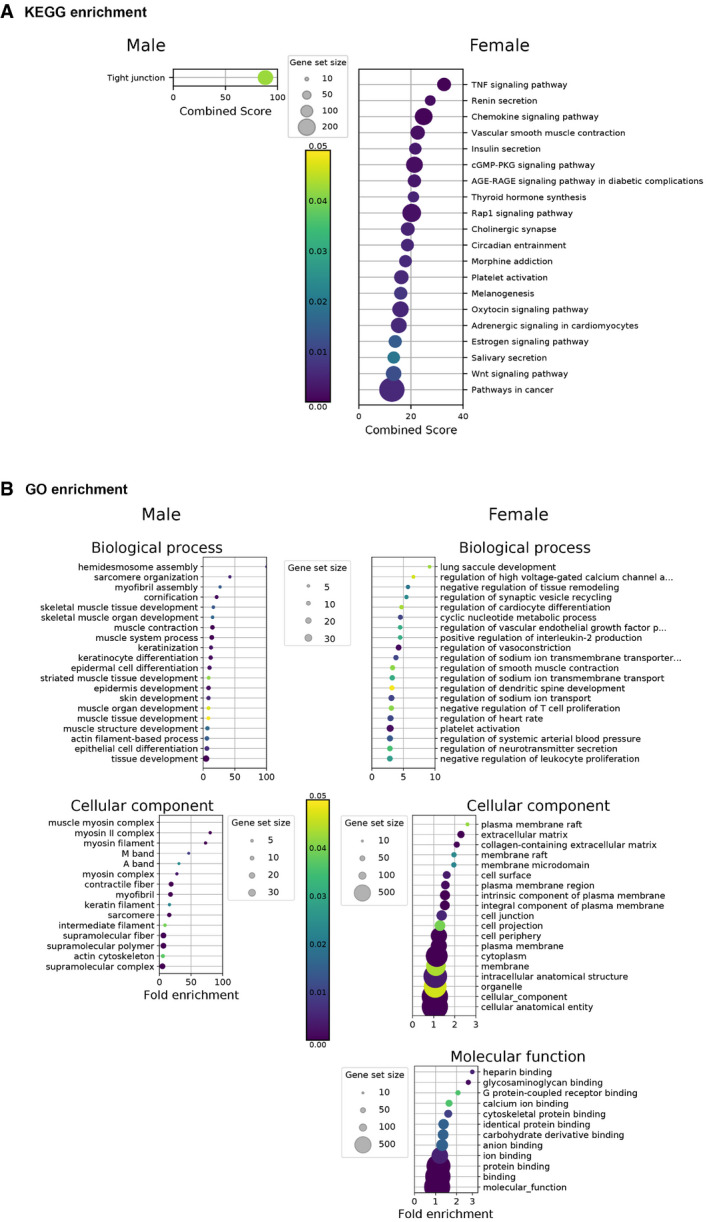
Figure EV4. Transcriptomic aspects in the lung of SARS‐CoV‐2‐infected and ivermectin‐treated hamsters compared to SARS‐CoV‐2‐infected and saline‐treated hamsters at 4 days post‐infection.

-
AKEGG enrichment.
-
BGO enrichment analysis.
Data information: Selected terms are based on the up‐ and downregulated genes between IVM‐treated (CoV_ivermectin) and saline‐treated (CoV_saline) samples. Only the 20 highest fold enrichments are plotted for the upregulated gene set. Circle sizes are proportional to the gene set size, which shows the total size of the gene set associated with GO terms. Circle color is proportional to the corrected P‐values. Complete analyses are listed in Dataset EV1.
Source data are available online for this figure.
