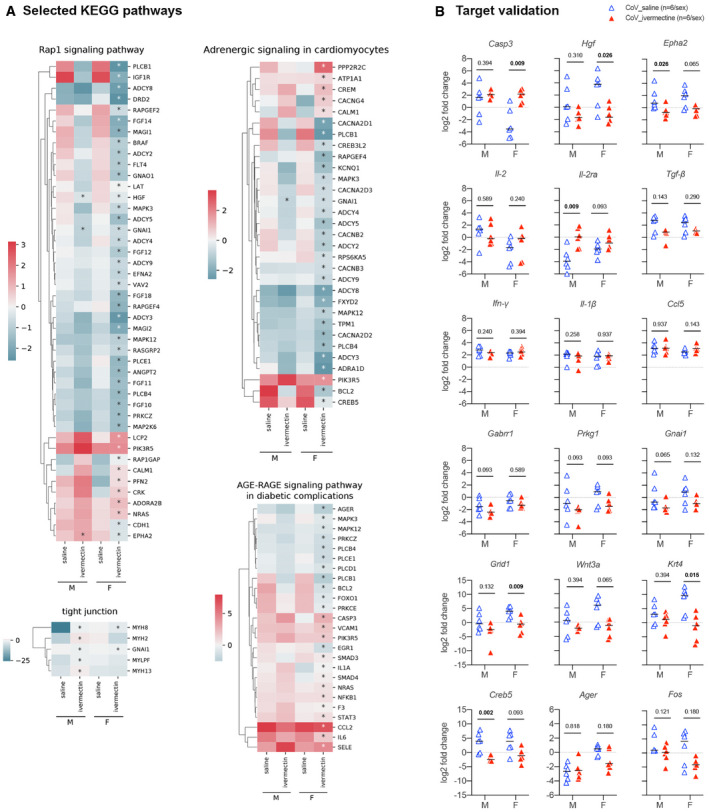
Figure EV5. Transcriptomic profile in the lung of SARS‐CoV‐2‐infected hamsters with and without ivermectin treatment at 4 days post‐infection.

-
AHeatmaps showing the differentially expressed genes according to the selected KEGG pathways, calculated in comparison with mock‐infected hamsters. * indicates Benjamini–Hochberg‐adjusted P‐value<0.05 in the comparison between saline and ivermectin within the same sex. Color gradient represents the transcription log2 fold change comparing infected and mock‐infected. Complete analyses are listed in Dataset EV1.
-
BValidation targets in the lung at 4 dpi. Horizontal lines indicate medians. The P value is indicated in bold when significant at a 0.05 threshold. Mann–Whitney test.
Data information: M: male hamsters and F: female hamsters. Data were obtained from two independent experiments for each sex.
Source data are available online for this figure.
