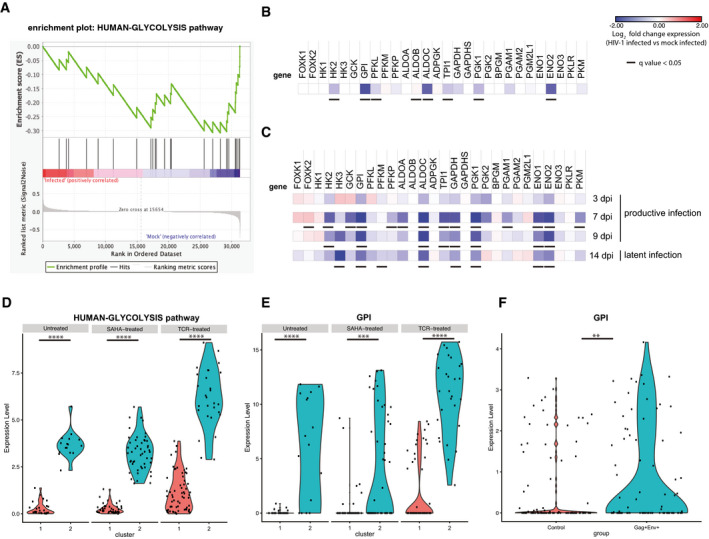
scRNA‐Seq of the expression of the entire glycolytic pathway or of glucose phosphate isomerase only (
GPI) in primary CD4
+ T cells infected
in vitro (D,E) or CD4
+ T cells of PLWH (F). In panels (D, E), cells were infected with VSVG‐HIV‐1‐GFP and sorted for viral expression as detailed in Golumbeanu
et al (
2018). Following latency establishment, cells were left untreated or HIV‐1 expression was reactivated through suberoylanilide hydroxamic acid (SAHA) or α‐CD3‐CD28 engagement. Clusters 1 and 2 were identified by principal component analysis as described in Golumbeanu
et al (
2018). In panel (F), CD4
+ T cells were isolated from total blood of PLWH under ART as described in Cohn
et al (
2018). Viral expression was reactivated by treatment with phytohemagglutinin (PHA), and cells were sorted using antibodies against Env and Gag. Sorted cells were then subjected to scRNA‐Seq analysis. The expression level of the HUMAN‐GLYCOLYSIS pathway in (D) was calculated as the average expression of genes comprising the gene list; expression levels in clusters 1 and 2 were compared using Wilcoxon rank‐sum test. For panels (E, F), significance of
GPI differential expression level between clusters (E) or between control and Env
+ Gag
+ conditions (F) was assessed by the Wilcoxon rank‐sum test encoded in FindMarkers Seurat R function. **
P < 0.01, ***
P < 0.001; ***
P < 0.0001. For panels (D, E)
n = 1 donor, 43 cells (untreated), 90 cells (SAHA), 91 cells (TCR), for panel (F)
n = 3 donors, 109 cells (control) and 85 cells (Gag
+ Env
+).

