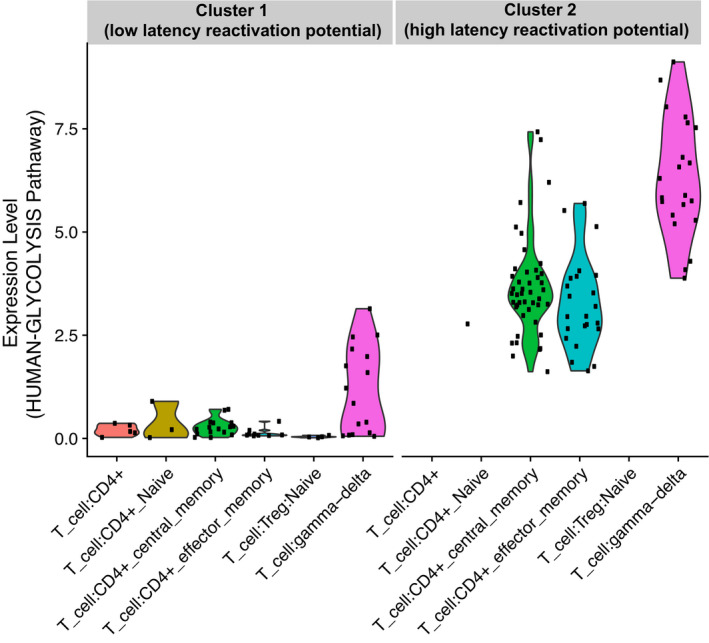
Figure EV1. Single‐cell transcriptional modulation of glycolytic enzymes in CD4+ T‐cell subsets.

The scRNA‐Seq expression of the entire glycolytic pathway was analyzed in primary CD4+ T cells infected in vitro with VSVG‐HIV‐1‐GFP and sorted for viral expression as detailed in Golumbeanu et al (2018). Following latency establishment, cells were left untreated or HIV‐1 expression was reactivated through suberoyl anilide hydroxamic acid (SAHA) or α‐CD3‐CD28 engagement. Clusters 1 (low latency reactivation potential) and 2 (high latency reactivation potential) were identified by principal component analysis as described in Golumbeanu et al (2018). T‐cell subtypes were identified using the SingleR R package and allocated to each cluster irrespective of the in vitro treatment. The expression level of the HUMAN‐GLYCOLYSIS pathway was calculated as the average expression of genes comprising the gene list. n = 1 donor, 131 cells (Cluster 1), 93 cells (Cluster 2).
