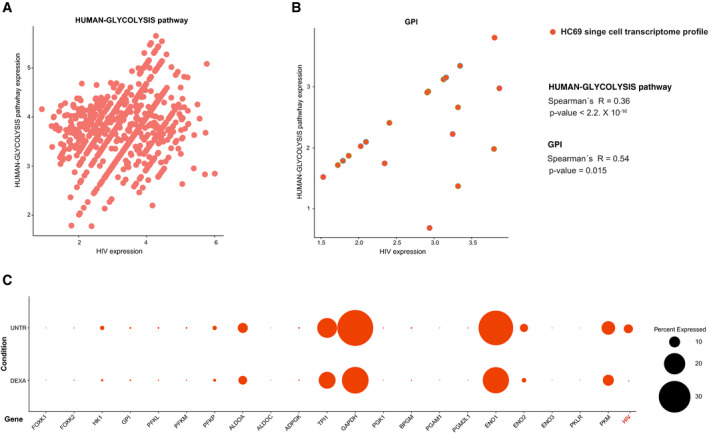
Figure EV2. Single‐cell level correlation between glycolytic genes and HIV‐1 expression in HC69 microglia.

-
A, BCorrelation of combined HIV‐1 expression and the expression of the entire glycolytic pathway (A) or GPI only (B) in scRNA‐Seq profiling of untreated HC69 microglial cells. Data were analyzed by Spearman's correlation coefficients.
-
CEffect of the glycolysis depressing agent dexamethasone (DEXA) on the baseline HIV‐1 expression in HC69 microglia cells. HC69 cells were left untreated or treated with DEXA (1 μM) for 72 h and then subjected to scRNA‐Seq. The bubble plot depicts the percentage of cells in which the transcriptional expression of HIV‐1 or the genes of the HUMAN‐GLYCOLYSIS pathway was detectable.
