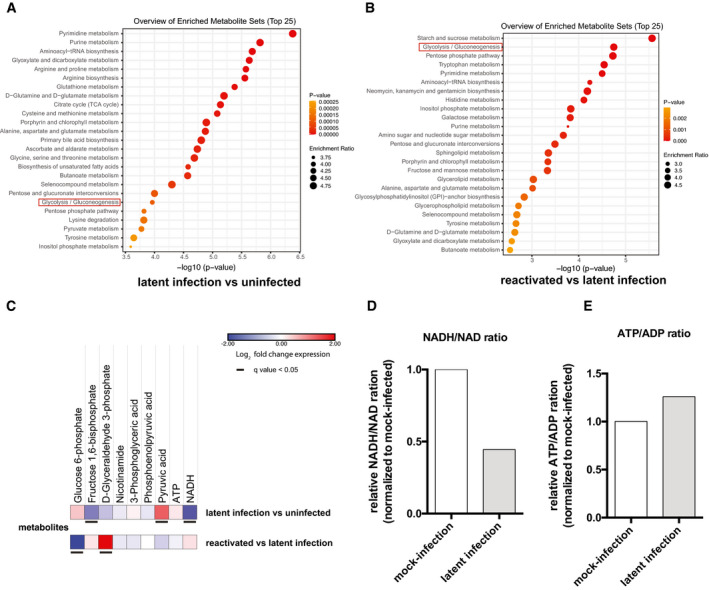
Figure EV3. Modulation of glycolysis and other metabolic pathways during productive or latent HIV‐1 infection in microglia cells.

-
A, BMetabolite enrichment analysis in latently infected as compared to uninfected cells (A) or in cells reactivated from latency as compared to latently infected cells (B). The top enriched pathways were ordered according to P‐values obtained by Q statistics for metabolic data sets performed with Globaltest (MetaboAnalyst) (Xia et al, 2009).
-
CHeatmaps of glycolytic metabolites in latently infected HC69 cells as compared to their uninfected counterparts or HC69 cells with HIV‐1 reactivated by TNF as compared to latently infected cells. Data are displayed as Log2 fold change expression. Adjusted P‐values (q values) were calculated by the Benjamini–Hochberg false discovery rate.
-
D, ERelative ratios of NADH/NAD+ (D) and ATP/ADP (E) in latently infected and reactivated cells. Data were normalized using the matching uninfected control.
