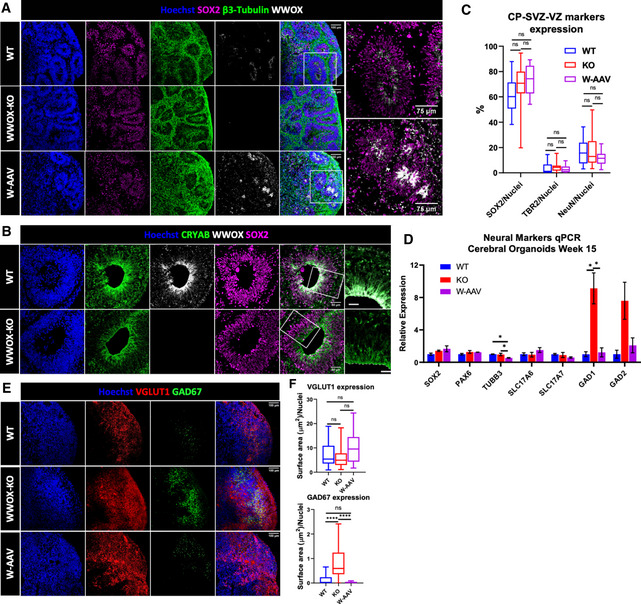
Figure 1. Generation and characterization of WWOX knockout cerebral organoids.

- Week 10 cerebral organoids (COs) stained for the progenitor marker SOX2, neuronal marker β3‐tubulin, and WWOX (WT: n = 8 from 3 batches, KO: n = 8 from 3 batches, and W‐AAV n = 4 from 1 batch). Scale = 100 µm (left), 75 µm (right).
- Week 10 COs stained for the ventricular radial glial (vRG) marker CRYAB, together with WWOX and the pan‐radial glia marker SOX2. The images on the right are enlargements of the boxed area. The dashed line defines the ventricular space (WT: n = 8 from 3 batches, KO: n = 8 from 3 batches). Scale = 50 µm (left), 25 µm (right).
- Quantification of markers that represent the different populations that compose the ventricular‐like zone (VZ), subventricular zone (SVZ), and the cortical plate (CP), as depicted in Appendix Fig S2B and C. NeuN marks the mature neurons, TBR2 marks the intermediate progenitors (IPs), and SOX2 marks the ventricular radial glia (vRGs). The boxplot represents the 1st and 3rd quartile, with its whiskers showing the minimum and maximum points and a central band representing the median. Statistical significance was determined using one‐way ANOVA with Tukey’s multiple comparisons test (WT: n = 8 from 3 batches; KO: n = 8 from 3 batches; W‐AAV: n = 4 from 1 batch).
- qPCR analysis for the assessment of expression levels of different neural markers in 15 weeks COs: SOX2 and PAX6 (progenitor cells), TUBB3 (pan‐neuronal), SLC17A6 and SLC17A7 (VGLUT2 and VGLUT1; glutamatergic neurons), and GAD1 and GAD2 (GAD67 and GAD65; GABAergic neurons). The y‐axis indicates relative expression fold change. Data are represented as mean ± SEM. Statistical significance was determined using one‐way ANOVA with Tukey’s multiple comparisons test (WT: n = 4 from 1 batch; KO: n = 4 from 1 batch; and W‐AAV: n = 4 from 1 batch).
- Immunofluorescent (IF) staining for the glutamatergic neuron marker VGLUT1 and GABAergic neuron marker GAD67 (GAD1) in week 10 COs (WT: n = 8 from 3 batches; KO: n = 8 from 3 batches; and W‐AAV: n = 4 from 1 batch). Scale = 100 µm.
- Quantification of the images represented in Fig 1E. VGLUT1 and GAD67 were quantified as the surface area covered by the staining and were normalized to the number of nuclei in each image. The boxplot represents the 1st and 3rd quartile, with its whiskers showing the minimum and maximum points and a central band representing the median. As the samples were not normally distributed, statistical significance was determined using the Kruskal–Wallis test with Dunn’s multiple comparisons test. Outliers were removed using the ROUT test (Q = 1%).
Data information: n.s (non‐significant), *P ≤ 0.05, and ****P ≤ 0.0001.
