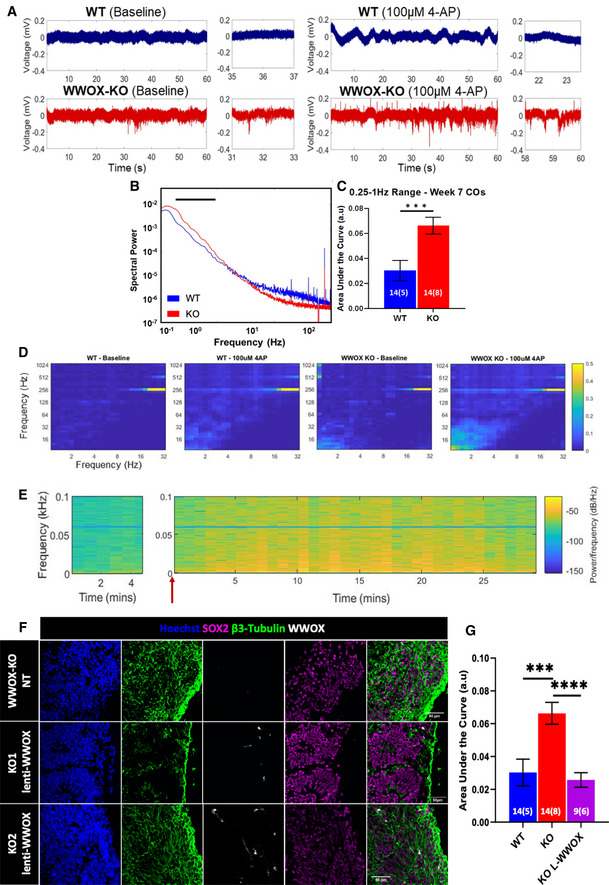
Figure 2. WWOX‐KO cerebral organoids demonstrated hyperexcitability and epileptiform activity.

-
ASample traces show visible differences in local field potential, with WWOX‐KO COs (red) showing increased activity compared with WT (blue) in baseline condition (left) and in the presence of 100 µM 4‐AP (right).
-
BMean spectral power of week 7 WT and KO COs in baseline conditions. The line marks 0.25‐ to 1‐Hz frequency range. Statistical significance was determined using the two‐tailed unpaired Welch’s t‐test (WT: n = 14 slices, 5 organoids, and 3 batches; KO: n = 14 slices, 8 organoids, and 3 batches).
-
CNormalized area under the curve of the mean spectral power in (B) for the 0.25‐ to 1‐Hz frequency range. Data represented by mean ± SEM. Statistical significance was determined using the two‐tailed unpaired Welch’s t‐test. The numerals in all bars indicate the number of analyzed slices and organoids (i.e., slices (organoids)).
-
DCFC analysis shows increased coupling in the δ: HFO frequency pairs. The color scale represents the modulation index—a measure of the coupling between the phase of low‐frequency oscillations and amplitude of high‐frequency oscillations in a given signal.
-
ESample spectrogram of WWOX‐KO slice shows a gradual increase in activity upon addition of 4‐AP (marked by red arrow) for up to 2 min, and a decrease after 25 min. All traces were filtered with a 60 Hz notch filter and 0.5 Hz high‐pass filter.
-
F, GWWOX’s coding sequence was reintroduced into week 6 WWOX‐KO COs using lentiviral transduction (lenti‐WWOX) (see Materials and Methods). (F) Immunofluorescent staining showing WWOX expression in different populations in WWOX‐KO organoids following infection with lentivirus. NT = non‐treated. Scale = 50 µm. (G) Normalized area under the curve of the mean spectral power of WT line, 2 KO lines, and 2 KO lines infected with lenti‐WWOX at week 7 in baseline condition, for the 0.25‐ to 1‐Hz frequency range. Data represented by mean ± SEM. The numerals in all bars indicate the number of analyzed slices and organoids (i.e., slices (organoids)). Statistical significance was determined using one‐way ANOVA with Tukey’s multiple comparisons test.
Data information: ***P ≤ 0.001 and ****P ≤ 0.0001.
