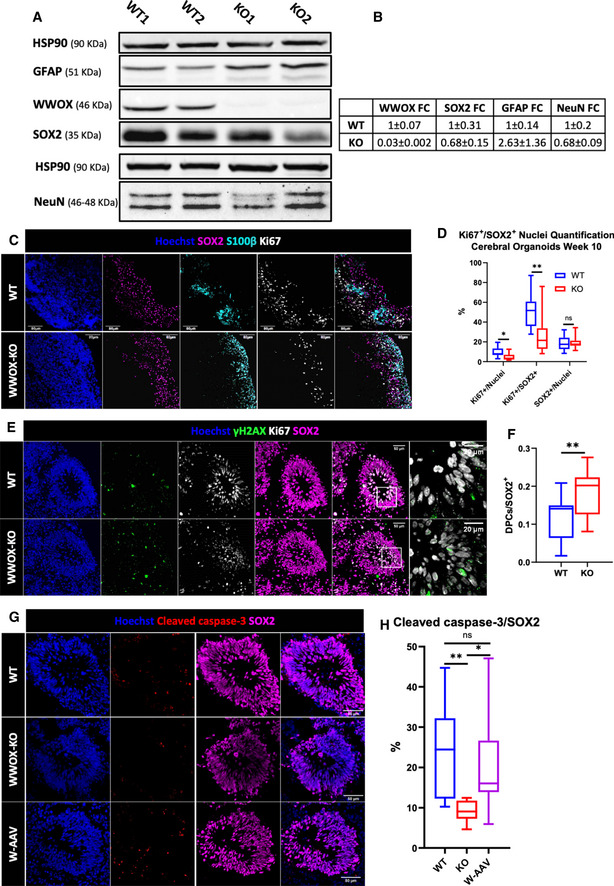
Figure EV2. WWOX‐KO cerebral organoids showed enhanced astrogenesis and loss of checkpoint inhibition.

- Western blot analysis of week 24 COs, examining the protein expression of WWOX, GFAP (astrocytes), SOX2 (RG cells), and NeuN (mature neurons).
- A summary of the band intensities of the Western blot exemplified in (A), presented as mean ± SEM of the WT COs and KO COs, and as fold change compared with the WT COs (WT: n = 2 from 1 batch; KO: n = 4 from 1 batch).
- IF staining of week 10 COs with the proliferation marker Ki67 localized with S100β (astrocytes) and SOX2 (RGs) (WT: n = 6 from 2 batches; KO: n = 4 from 2 batches).
- Quantification of (C). The boxplot represents the 1st and 3rd quartile, with its whiskers showing the minimum and maximum points and a central band representing the median. Statistical significance was determined using the two‐tailed unpaired Welch’s t‐test (WT: n = 6 from 2 batches; KO: n = 4 from 2 batches).
- Week 10 COs stained for Ki67 (proliferation), γH2AX (DNA breaks) and SOX2 (RGs) (WT: n = 6 from 2 batches; KO: n = 4 from 2 batches).
- Quantification of γH2AX+/Ki67+ double‐positive cells (DPCs) normalized to the number of SOX2+ cells, corresponding to the size of the VZ, seen in (C). The boxplot represents the 1st and 3rd quartile, with its whiskers showing the minimum and maximum points and a central band representing the median. Statistical significance was determined using the two‐tailed unpaired Welch’s t‐test (WT: n = 6 from 2 batches; KO: n = 4 from 2 batches).
- Week 10 COs co‐stained for the apoptosis marker cleaved caspase‐3 and the RG marker SOX2 in the VZ of WT, KO and W‐AAV COs (WT: n = 6 from 2 batches; KO: n = 4 from 2 batches; and W‐AAV: n = 4 from 1 batch). Scale = 50 µm.
- Quantification of the data presented in (G). The boxplot represents the 1st and 3rd quartile, with its whiskers showing the minimum and maximum points and a central band representing the median. Statistical significance was determined using one‐way ANOVA with Tukey’s multiple comparisons test (WT: n = 6 from 2 batches; KO: n = 4 from 2 batches; W‐AAV: n = 4 from 1 batch).
Data information: n.s (non‐significant), *P ≤ 0.05, **P ≤ 0.01.
