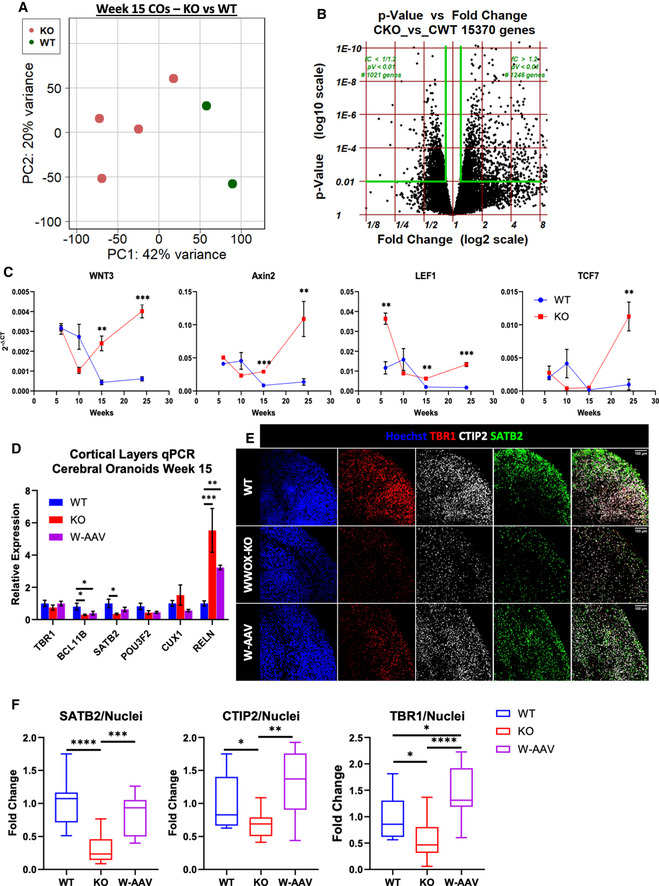
Figure EV3. Cerebral organoid RNA sequencing revealed major differentiation defects.

- Principal component analysis (PCA) plot using the top two principal components, showing the RNA‐seq data form week 15 COs. PCA revealed two distinct clusters corresponding to the biological identity of the sample—WT or WWOX‐KO.
- Volcano plot representing differentially expressed genes in the sequenced COs based on fold change (x‐axis) and P‐value (y‐axis). The P‐value was calculated using the Wald test.
- qPCR analysis of the kinetics of Wnt‐related genes at week 6, 10, 15 and 24 COs. Data are represented as mean ± SEM. Statistical significance was determined using the two‐tailed unpaired Welch’s t‐test (WT W6: n = 3; KO W6: n = 3; WT W10: n = 3; KO W10: n = 3; WT W15: n = 4; KO W15: n = 4; WT W24: n = 4; and KO W24: n = 3).
- qPCR for markers of the six different layers of the human cortex in week 15 COs. Data are represented as mean ± SEM. Statistical significance was determined using one‐way ANOVA with Tukey’s multiple comparisons test (WT: n = 4 from 1 batch; KO: n = 4 from 1 batch; and W‐AAV: n = 4 from 1 batch).
- Immunofluorescent staining of cortical layer markers SATB2, CTIP2, and TBR1 in week 24 COs (WT: n = 10 from 4 batches; KO: n = 9 from 3 batches; and W‐AAV: n = 4 from 1 batch).
- Quantification of the cortical markers seen in E, normalized to the total number of nuclei. The y‐axis indicates the fold change compared with the average of the WT COs. The boxplot represents the 1st and 3rd quartile, with its whiskers showing the minimum and maximum points and a central band representing the median. Statistical significance was determined using one‐way ANOVA with Tukey’s multiple comparisons test (WT: n = 10 from 4 batches; KO: n = 9 from 3 batches; and W‐AAV: n = 4 from 1 batch batches).
Data information: *P ≤ 0.05, **P ≤ 0.01, and ***P ≤ 0.001.
