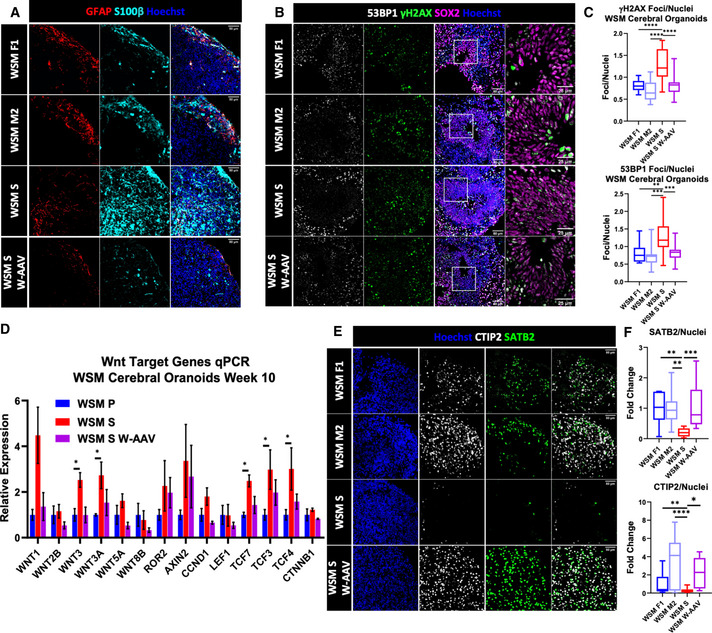
Figure 6. WWOX‐related epileptic encephalopathies depict molecular abnormalities similar to a complete WWOX loss.

- Week 15 WSM COs stained for astrocytic markers GFAP and S100β. (WSM F1: n = 2 from 1 batch; WSM M2: n = 3 from 1 batch; WSM S2: n = 2 from 1 batch; WSM S5: n = 2 from 1 batch; WSM S5 W‐AAV3: n = 2 from 1 batch; and WSM S5 W‐AAV6: n = 2 from 1 batch). Scale = 50 µm.
- Impaired DNA damage response in WOREE‐derived organoids. SOX2 marks the radial glia in the VZ (WSM F1: n = 4 from 1 batch; WSM M2: n = 4 from 1 batch; WSM S2: n = 4 from 1 batch; WSM S5: n = 4 from 1 batch; WSM S5 W‐AAV3: n = 4 from 1 batch; and WSM S5 W‐AAV6: n = 4 from 1 batch). Scale = 50 µm (left) and 25 µm (right).
- Quantification of DNA damage foci, marked by γH2AX (left) and 53BP1 (right), in the nuclei of the cells in the VZs of week 6 WSM COs. The boxplot represents the 1st and 3rd quartile, with its whiskers showing the minimum and maximum points and a central band representing the median. Statistical significance was determined using one‐way ANOVA with Tukey’s multiple comparisons test (WSM F1: n = 4 from 1 batch; WSM M2: n = 4 from 1 batch; WSM S2: n = 4 from 1 batch; WSM S5: n = 4 from 1 batch; WSM S5 W‐AAV3: n = 4 from 1 batch; and WSM S5 W‐AAV6: n = 4 from 1 batch).
- qPCR analysis for selected Wnt target genes in week 10 WSM COs. The y‐axis indicates relative expression fold change. Data are represented as mean ± SEM. Statistical significance was determined using one‐way ANOVA with Tukey’s multiple comparisons test (WSM P: n = 6 from 1 batch; WSM S: n = 4 from 1 batch; and WSM S W‐AAV: n = 4 from 1 batch).
- Week 15 WSM COs stained for the cortical layers’ markers CTIP2 and SATB2. (WSM F1: n = 2 from 1 batch; WSM M2: n = 3 from 1 batch; WSM S2: n = 2 from 1 batch; WSM S5: n = 2 from 1 batch; WSM S5 W‐AAV3: n = 2 from 1 batch; and WSM S5 W‐AAV6: n = 2 from 1 batch). Scale = 50 µm.
- Quantification of the staining presented in E. The boxplot represents the 1st and 3rd quartile, with its whiskers showing the minimum and maximum points and a central band representing the median. Statistical significance was determined using one‐way ANOVA with Tukey’s multiple comparisons test (WSM F1: n = 2 from 1 batch; WSM M2: n = 3 from 1 batch; WSM S2: n = 2 from 1 batch; WSM S5: n = 2 from 1 batch; WSM S5 W‐AAV3: n = 2 from 1 batch; and WSM S5 W‐AAV6: n = 2 from 1 batch).
Data information: *P ≤ 0.05, **P ≤ 0.01, ***P ≤ 0.001, and ****P ≤ 0.0001.
