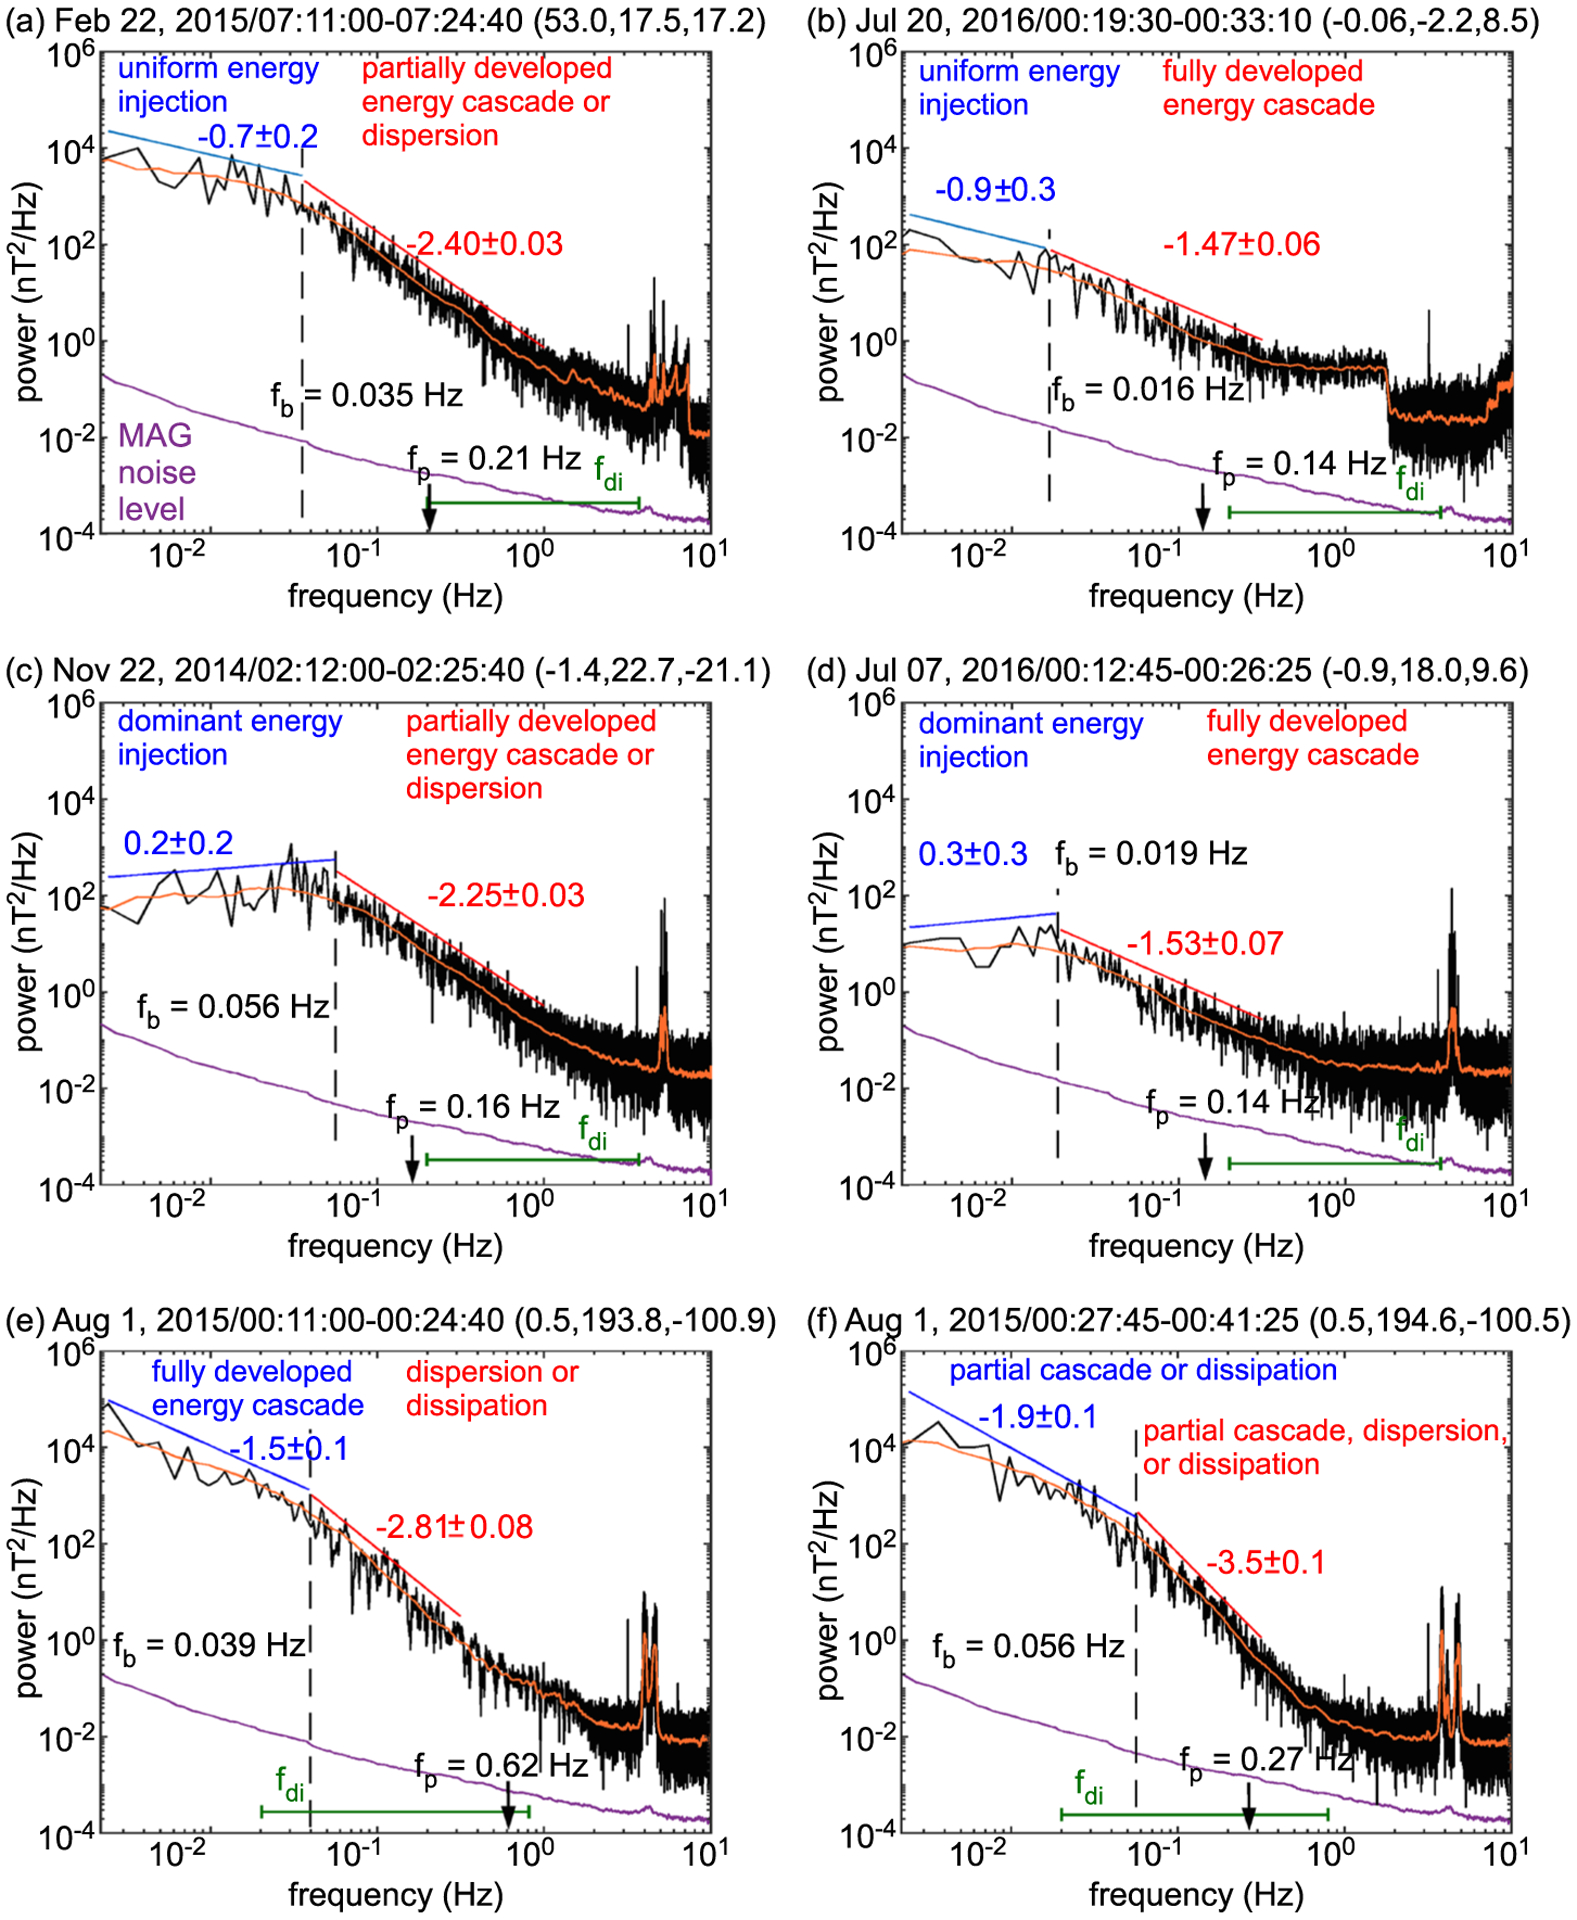
Figure 2.

Six different power spectra of magnetic field fluctuations observed at comet 67P, which depict six different combinations of turbulent processes, are shown in (a–f). The frequency at which a sharp transition of the spectral indices occurs is indicated by f b, which is the spectral break frequency. The local proton gyrofrequency is indicated by f p. The time interval associated with each power spectrum is provided above each panel. The mean solar equatorial frame (CSEQ) coordinates for the spacecraft are also provided in kilometers, within brackets above each panel.
