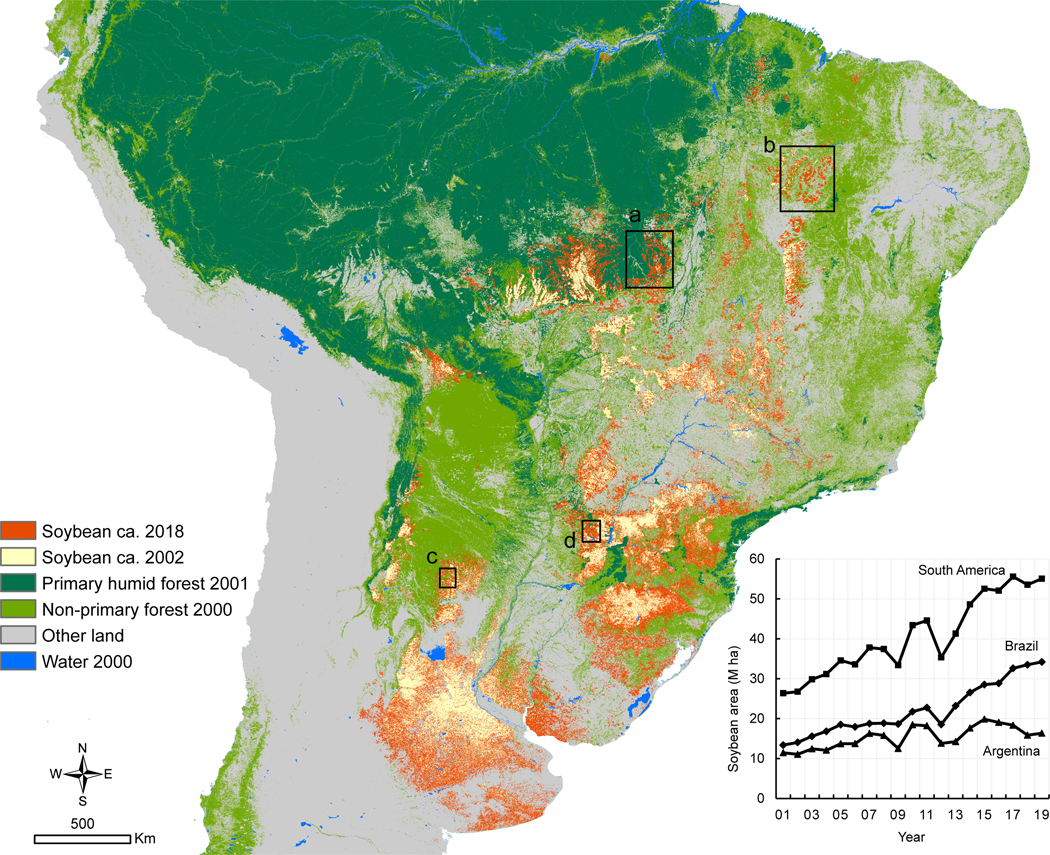
Fig. 1.
Soybean expansion across South America in the 21st century. Annual soybean classification maps were generated at 30 m spatial resolution from 2001 to 2019. Data from the beginning and ending years are used in this visualization to show soybean expansion. To reduce the effect of annual crop rotation on data visualization, for this map we applied a 3-year majority filter for the beginning and ending years to derive soybean layers circa (ca.) 2002 and 2018. The inset at the lower bottom corner shows annual soybean area statistics over South America, Brazil and Argentina, derived from the annual maps without filtering. Black boxes and labels on the map indicate the spatial extents of regional examples shown in Fig. 2.

