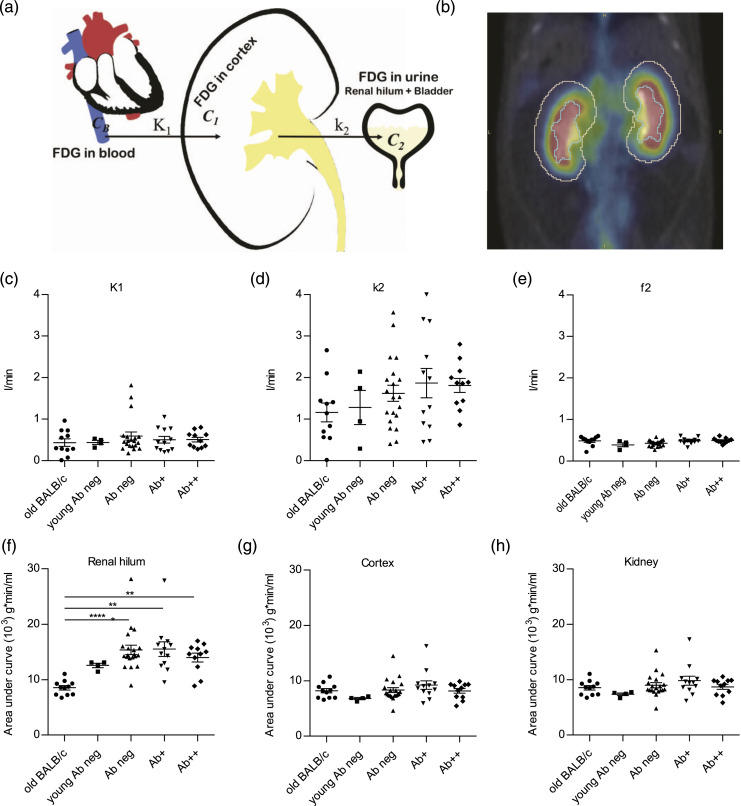
Figure 1.
Renal hilum SUV increased in anti-dsDNA Ab+ mice. (a) Illustrates the three-compartment model. C B , C1, and C2 represent tracer in the blood (input function), activity concentration in the parenchyma, and urine, respectively. (b) Cortex and renal hilum were delineated based on CT. There was no difference in K1 (c) and f2 (e) between the groups, but k2 (d) increased during SLE progression. Area-under-curve of renal hilum (f) increased during SLE progression, while AUCs of cortex (g) and whole kidney (h) were steady. (c)–(h) One-way ANOVA with post-hoc analysis (Dunn’s multiple comparisons test). *p < 0.05, **p < 0.01, ***p < 0.001, ****p < 0.0001.

