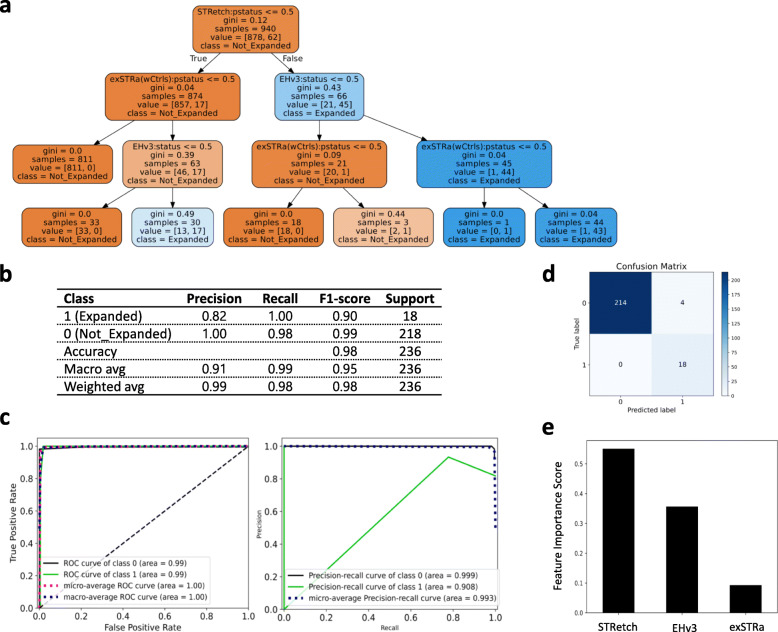
Fig. 1.
Decision tree model and its performance metrics on modified analysis of BWA-aligned EGA genomes. a Decision tree generated on the training dataset (n = 940). Node #0 at the top of the tree is the root node. Each node lists an STR tool (feature). The “samples” number represents the total number of genotype calls in a particular node, and “value” shows the number of expanded (or full-mutation, FM) and non-expanded (non-FM) genotypes. Gini index shows the impurity at each node. The terminal nodes or leaves with a Gini value of 0 have genotypes belonging entirely to either the expanded or non-expanded class. EHv3, ExpansionHunter version 3; wCtrls, analysis performed with controls. b Classification report summarizing the performance metrics of the model on test data (n = 236). Macro and weighted average (avg) show the unweighted and weighted mean of performance metrics calculated for Expanded and Not_Expanded class labels, respectively. c Receiver operating characteristics and precision-recall curves. d Confusion matrix showing the number of predicted and true labels on x- and y-axis, respectively. e Feature importance plot showing the STR tool on x-axis and the tool’s normalized (Gini) importance on y-axis

