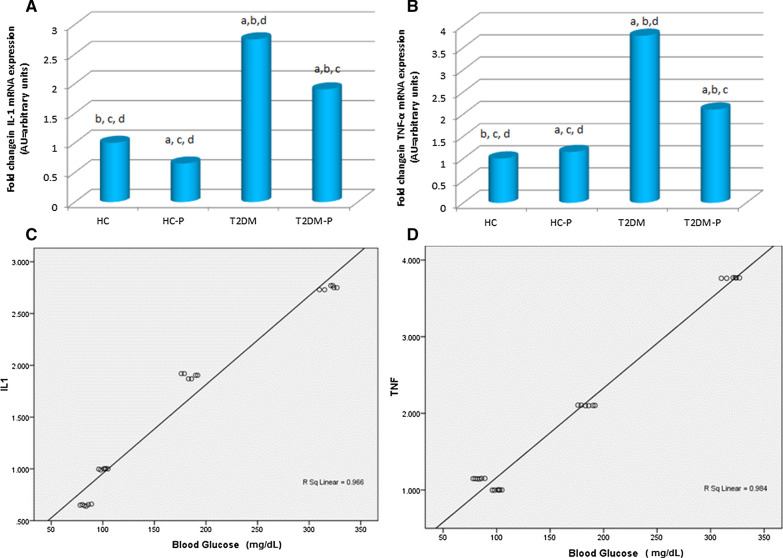
Fig. 3.
The relative expression of the intestinal pro-inflammatory cytokines after 10 days probiotic intervention. A The effects of probiotic on mRNA expression of IL-1β were determined by PCR. B The relative expression of TNF-α from all trail groups represent. The expression levels of β-actin were used as a loading control. C The Correlation of IL-1β to blood glucose. D The Correlation of TNF-α vs. blood glucose. Control group (HC), Control + Probiotic (HC-P), Diabetic group (T2DM), Diabetic group with probiotic(T2DM-P) groups. a Significant difference of other groups vs. HC. b Significant difference of other groups vs. HC-P. c Significant difference of other groups vs. T2DM. d Significant difference of other groups vs. T2DM-P The mean difference is significant at p < 0.001

