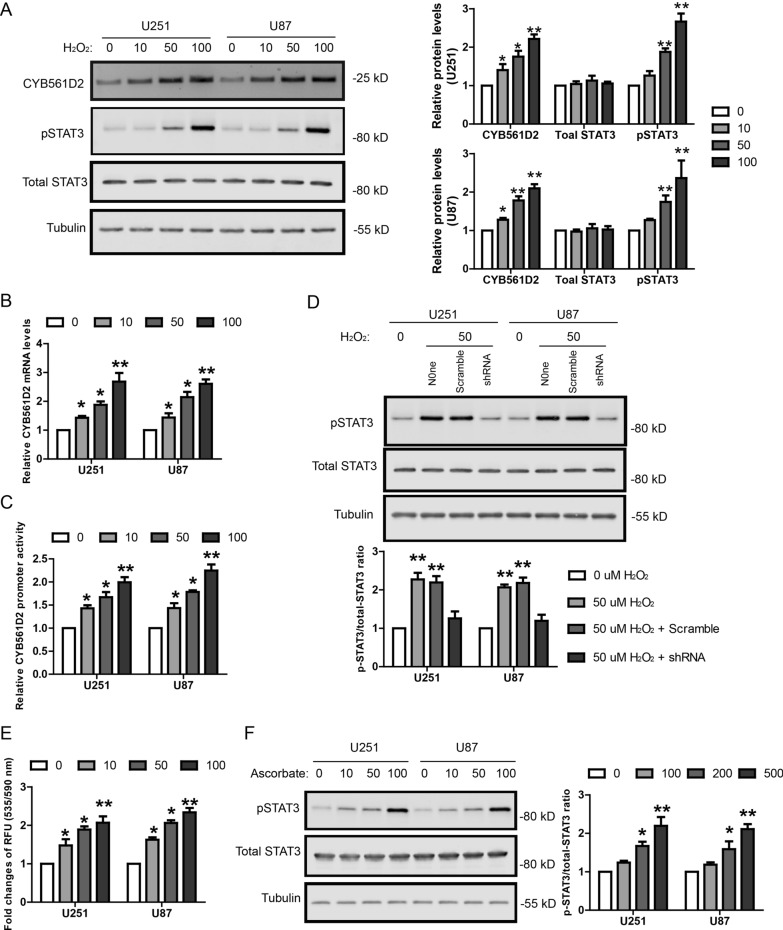
Fig. 3.
ROS induces CYB561D2 expression and activates STAT3 in gliomas. A Representative western blot and its quantification showing the protein levels of CYB561D2, p-STAT3 and total STAT3 in U251 and U87 cell lines treated with H2O2 at indicated concentrations (0, 10, 50 and 100 µM) for 2 h. B qRT-PCR results showing the relative mRNA levels of CYB561D2 in U251 and U87 cell lines treated with H2O2 at indicated concentrations (0, 10, 50 and 100 µM) for 2 h. C Luciferase assay showing the activity of CYB561D2 promoter in U251 and U87 cell lines treated with H2O2 at indicated concentrations (0, 10, 50 and 100 µM) for 2 h. D Representative western blot and its quantification showing the protein levels of pSTAT3 and total STAT3 in U251 and U87 cell lines treated with H2O2 and infected with Scramble or CYB561D2 shRNA. E Quantification of intra-cellular levels of ascorbate in U251 and U87 cell lines treated with H2O2 at indicated concentrations (0, 10, 50 and 100 µM) for 2 h. F Representative western blot and its quantification showing the protein levels of pSTAT3 and total STAT3 in U251 and U87 cell lines treated with ascorbate at indicated concentrations (0, 100, 200 and 500 µM) for 2 h

