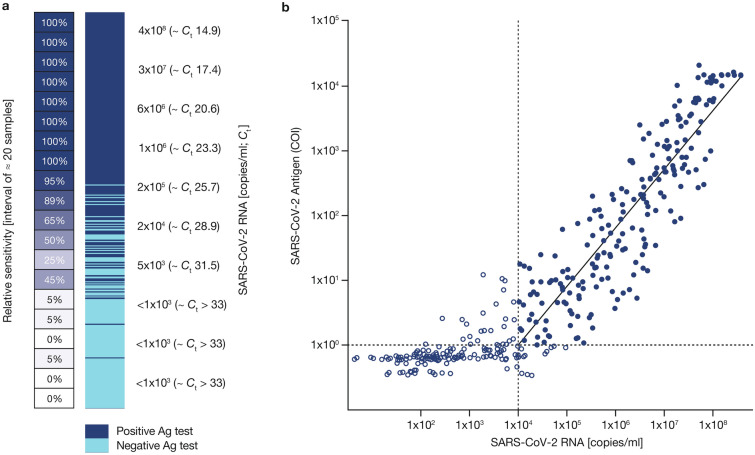
Fig. 2.
a Elecsys SARS-CoV-2 Antigen assay results in relation to cobas SARS-CoV-2 RNA copies/ml. Dark blue fields represent positive and light blue fields represent negative Elecsys SARS-CoV-2 Antigen test results. On left side, sensitivity was calculated every ≈ 20 samples included in the interval of the heatmap (copies/ml); b correlation between Elecsys SARS-CoV-2 Antigen assay (log10 [COI], y-axis) and cobas SARS-CoV-2 PCR assay (log10 [RNA copies/ml], x-axis). Closed blue circles: measurements within linear range considered for the trendline and correlation (SARS-CoV-2 RNA ≥ 105 copies/ml; COI ≥ 1). Open blue circles: measurements outside of the linear range of Elecsys SARS-CoV-2 or one cobas SARS-CoV-2 PCR Target negative, not considered for trendline and correlation. p < 0.0001; r2 = 0.786. Ag antigen, COI cutoff index, Ct cycle threshold

