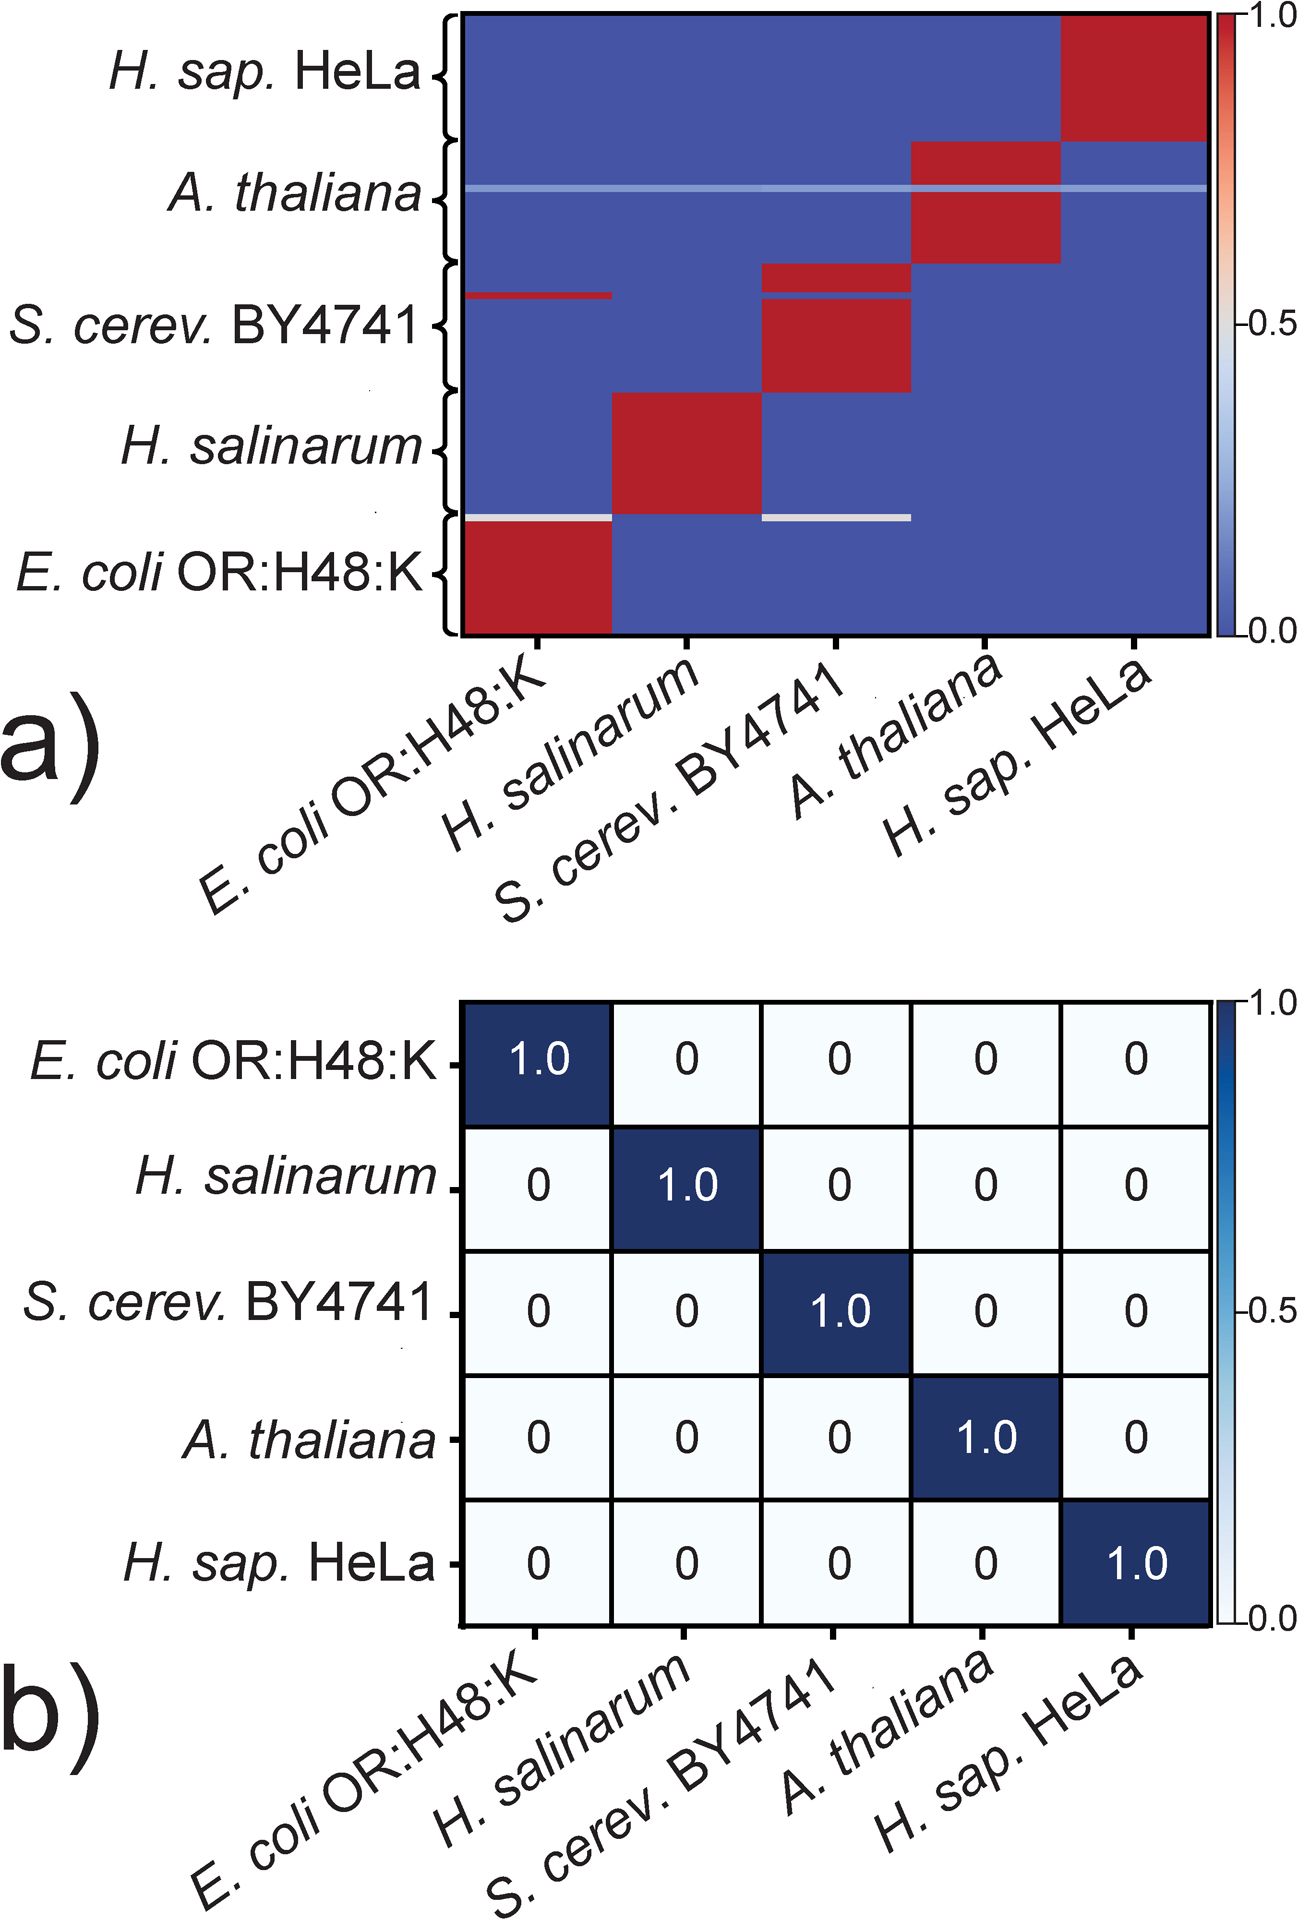
Figure 1.

Results obtained by training a) and testing b) the gradient boosting (GB) algorithm on the representative data summarized in Table S1 of S.I. (see Experimental). The initial dataset, which comprised rPTM profiles acquired in 25 replicate analyses per organism (i.e., N = 25), was randomly split into training and testing sets of 70:30 proportions. Panel a) Frequency by which a training datapoint on the y-axis was assigned to a class on the x-axis during leave-one-out (LOO) iterations between rule-formulation and cross-validation steps. Panel b) Frequency by which testing datapoints of a given class plotted on the y-axis were assigned to one of the classes on the x-axis. Color gradients convey frequencies of assignment.
