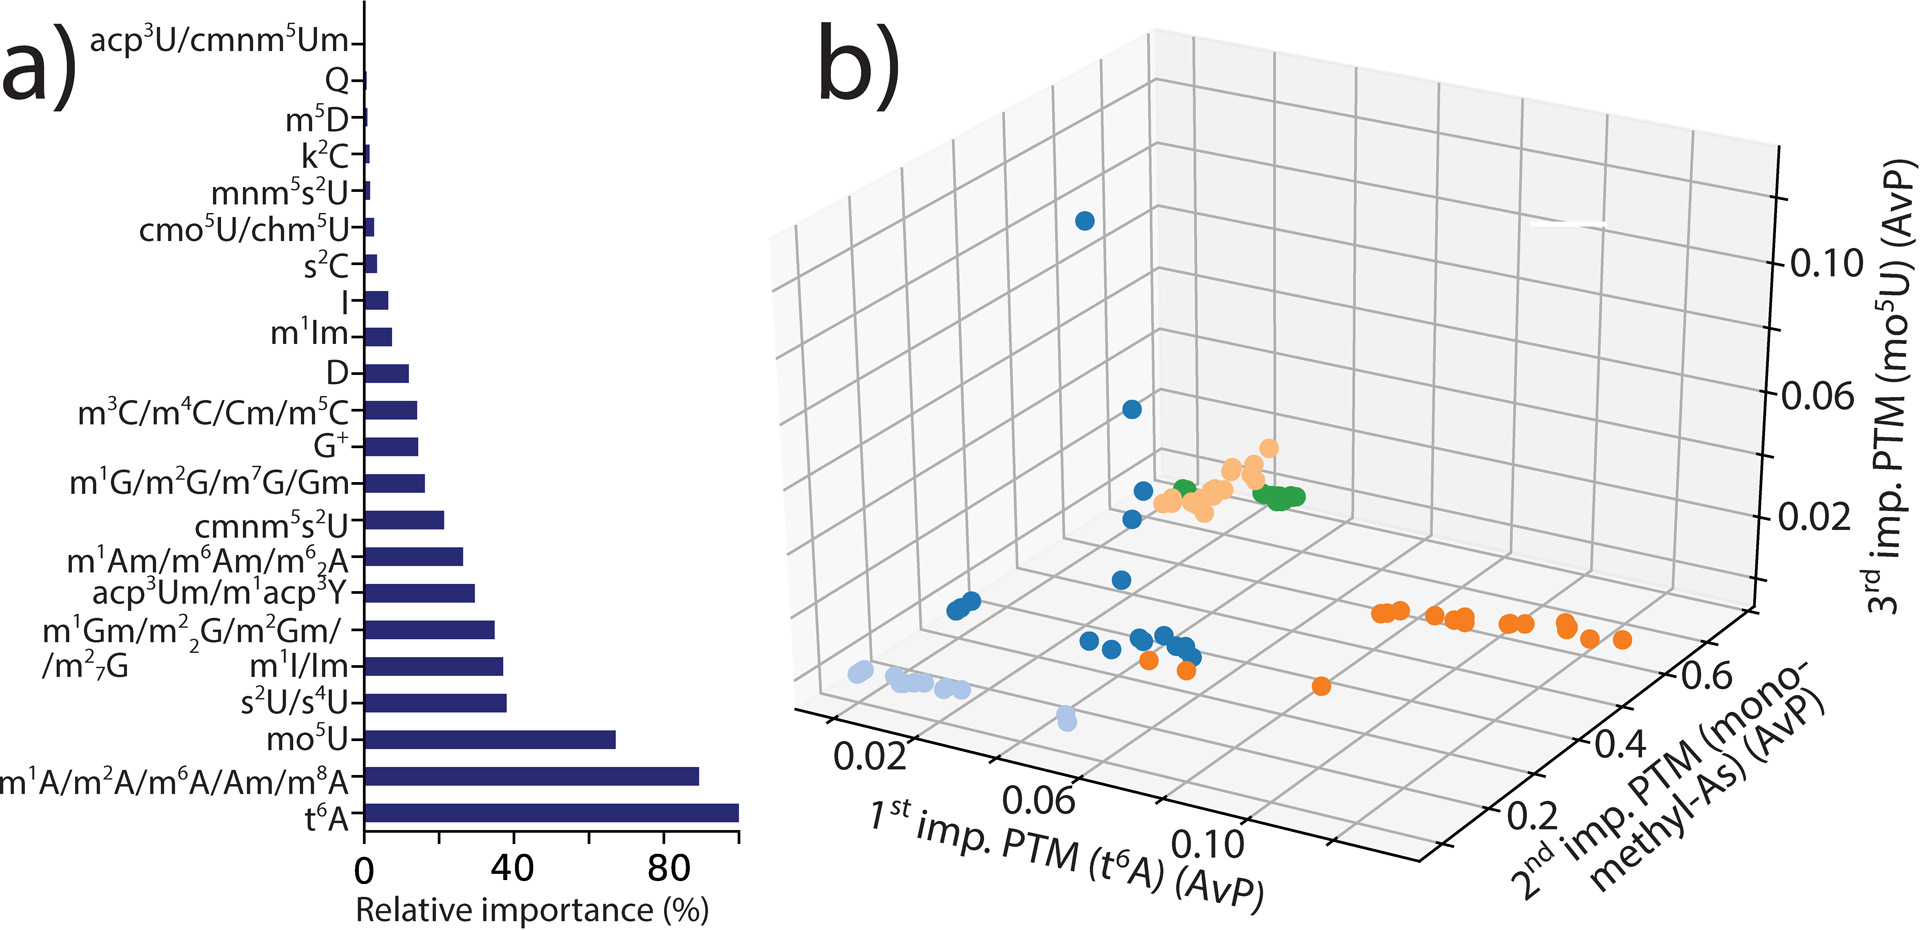
Figure 2.

a) Relative importance of rPTMs on GB predictions and b) correlation between the three more important rPTMs in the various profiles. The bars in panel a) convey the weight of each rPTM in differentiating the various classes, which was obtained by activating the “feature importance” attribute of the GB classifier (see Experimental of S.I.). In panel b), the weighty rPTMs are plotted on different axes to visualize correlations across classes. E. coli OR:H48:K data points are shown as dark blue dots; H. salinarum light blue; S. cerevisiae BY4741 dark orange; A. thaliana light orange; and H. sapiens HeLa green.
