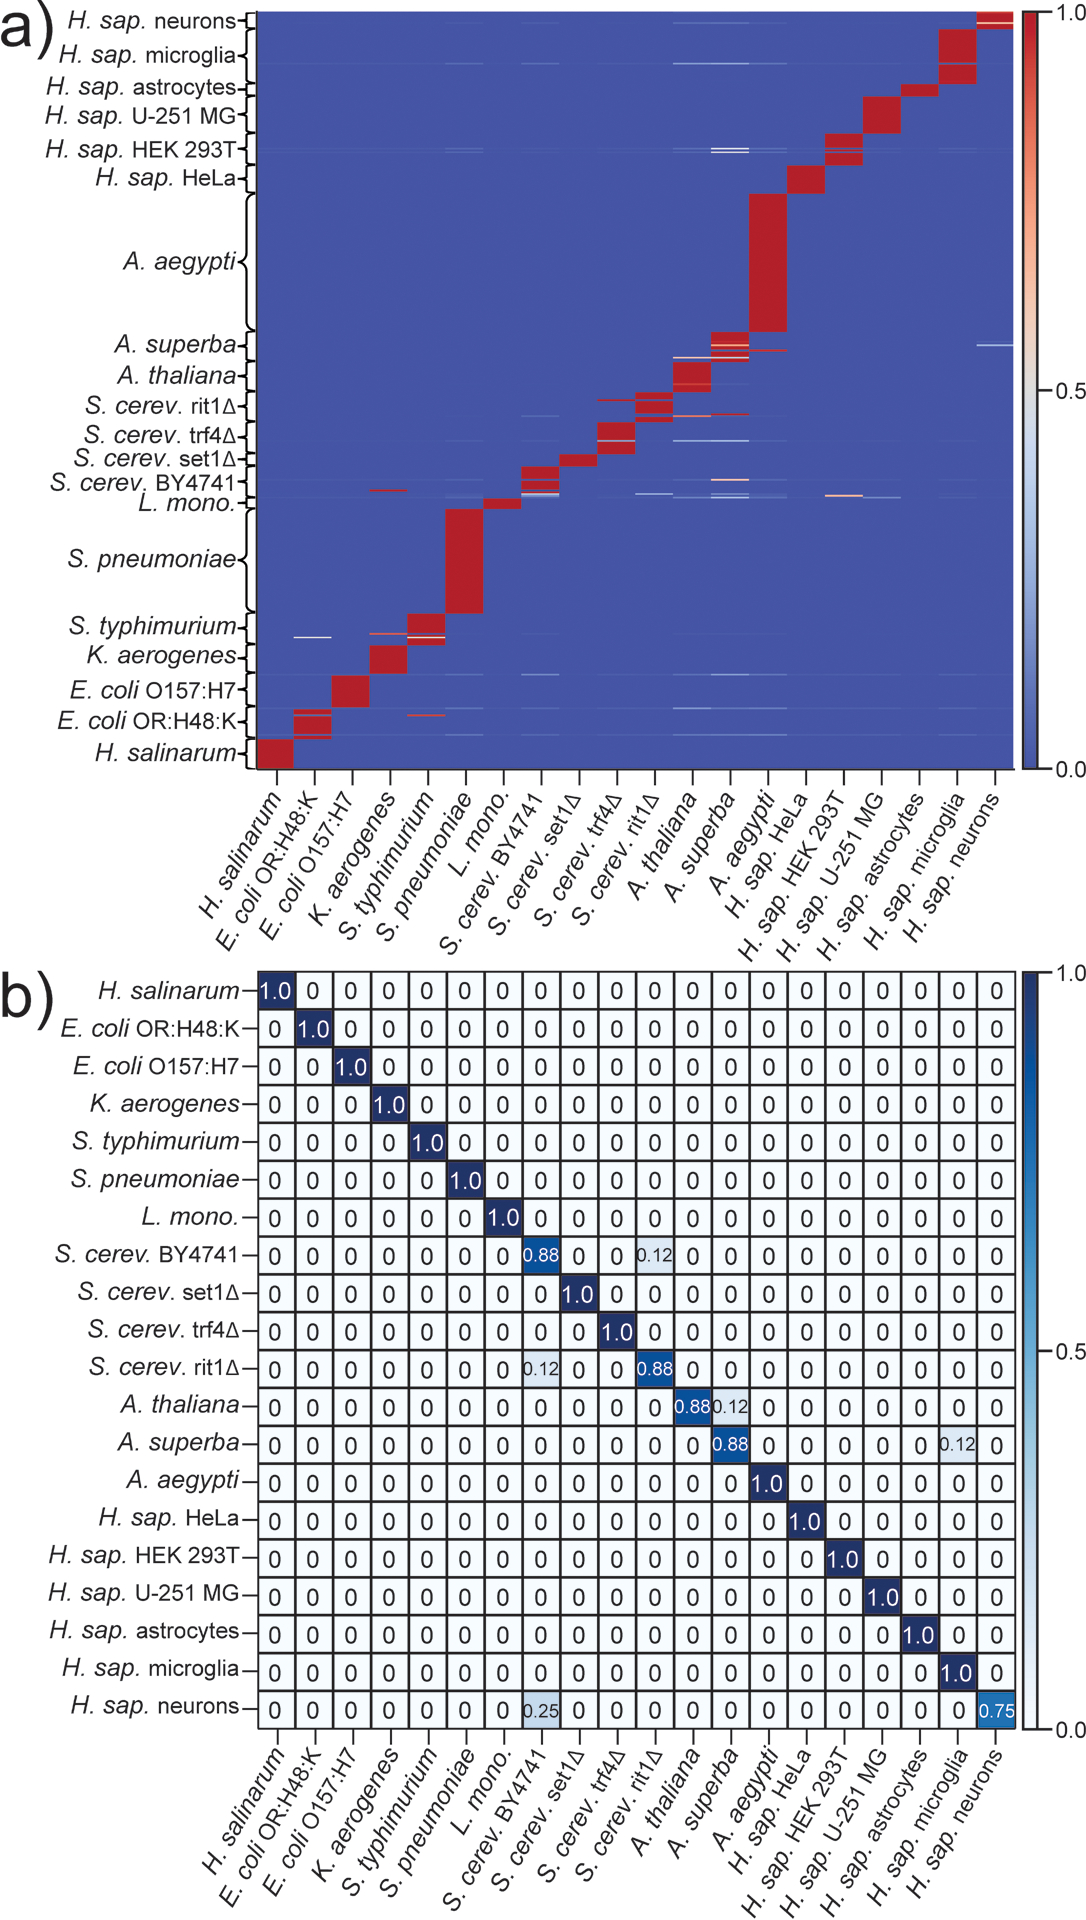
Figure 3.

Representative results obtained by training a) and testing b) the gradient boosting (GB) algorithm on rPTM profiles from 20 different classes (see Experimental). Predicted and actual classes are reported on the x- and y-axis, respectively. Color gradients express the frequency by which a data point was assigned to a given class. The following classes were considered: H. salinarum (N = 25 for both training/testing); E. coli OR:H48:K (N = 25) and O157:H7 (N = 25); K. aerogenes (N = 25); S. typhimurium (N = 25); S. pneumoniae (N = 85); L. monocytogenes (N = 10); S. cerevisiae samples BY4741 (N = 25), set1Δ (N = 10), trf4Δ (N = 25) and rit1Δ (N = 25); A. thaliana (N = 25); A. superba (N = 25); A. aegypti (N = 110); and H. sapiens samples HeLa (N = 25), HEK 293T (N = 25), U251 MG (N = 30), astrocytes (N = 10), microglia (N = 45), and neurons (N = 15).
