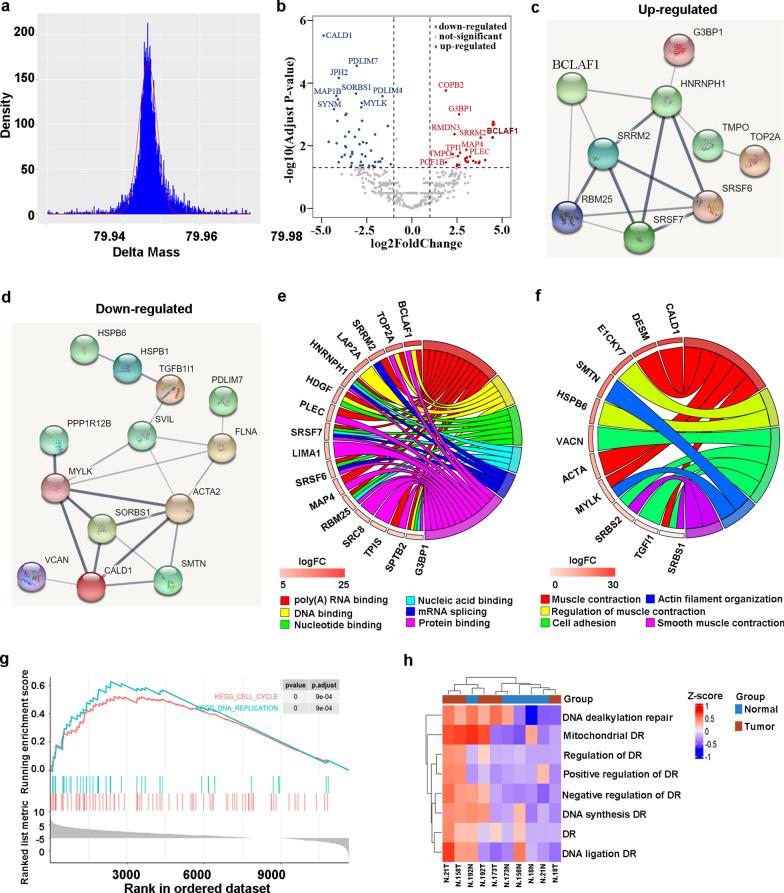
Fig. 1.
Dysregulated DNA damage response in gastric cancer unraveled by quick label-free phosphoproteomics. a Phosphopeptide ratio distribution. b Volcano plot to show the differential phosphoproteins with unique phospho-sites in gastric cancer and paired non-tumor tissues, with candidate phosphoproteins marked, including BCLAF1 (dark red). The red points represented the up-regulated phosphoproteins, while blue points represented the down-regulated phosphoproteins. Multiple hypothesis testing based on FDR. c PPI of up-regulated phosphoproteins. d PPI of down-regulated phosphoproteins. e The chord diagram of enrichment analysis for the up-regulated phosphoproteins. f The chord diagram of enrichment analysis for the down-regulated phosphoproteins. g GSEA analysis of the DEPs between gastric cancer and paired non-tumor tissues. h GSVA was used to analyze these DEPs closely related to DNA repair

