Fig. 1.
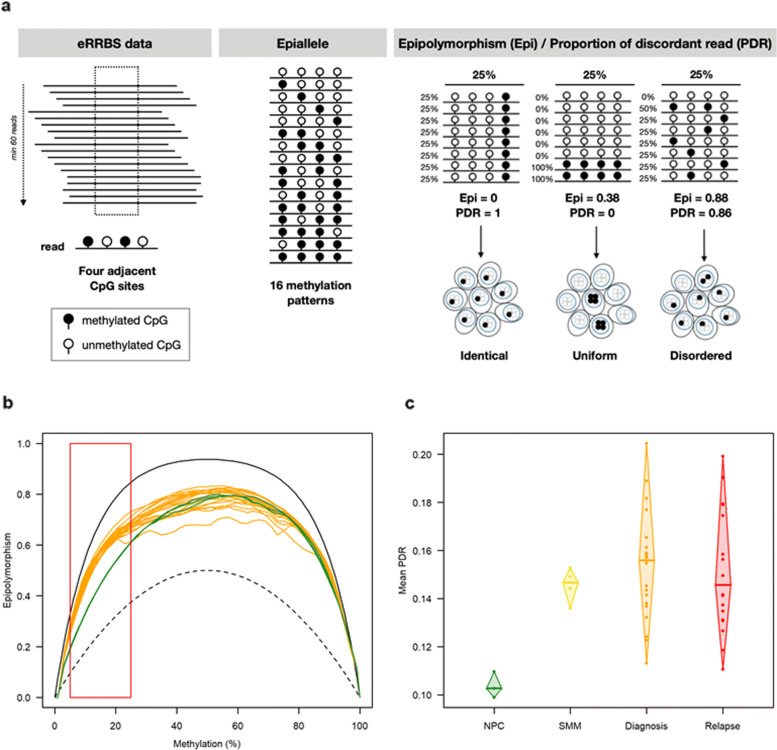
Intrapatient DNA methylation heterogeneity in MM. a Locus detection of 4 adjacent CpGs covered by the same read by Methclone tools [32], with at least 60 reads (filled black circle: methylated CpG; empty circle: unmethylated CpG). Sixteen methylation patterns of the epiallele from 4 adjacent CpGs are possible. Assessment of two metrics of epigenetic heterogeneity by locus: the epipolymorphism value (Epi) taking into account the distribution of the probabilities of these 16 possible methylation patterns and the proportion of discordant read value (PDR) taking into account reads with both methylated and unmethylated CpGs. For the same average level of methylation, different Epi and PDR values are possible depending on the bulk. b Epipolymorphism levels as a function of the average DNA methylation at each locus in NPC (green) and diagnosis (orange) samples. This color code was used in all figures. The maximal epipolymorphism (continuous black line) and the bimodal epipolymorphism (dotted black line) for each methylation level are represented. c Mean proportion of discordant reads per sample

