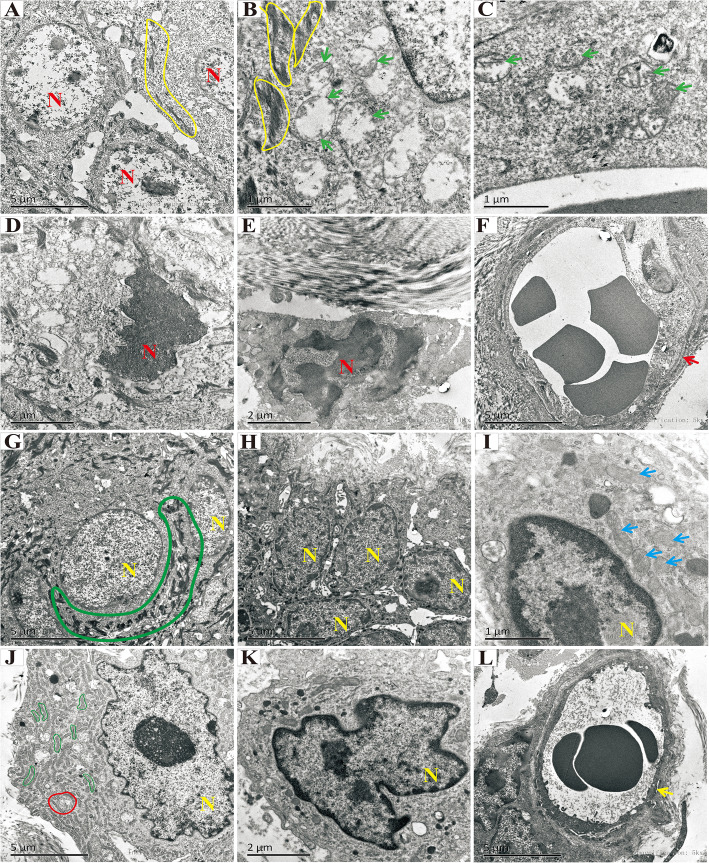
Fig. 5.
Transmission electron microscopic analysis of the ultrastructure of skin tissues or rats in the control group at 4 weeks post-irradiation (A–F) and the ADSC group at 4 weeks post-irradiation (G–L). Yellow curves indicate irregular desmosomes (A, B). Green arrows indicate damaged mitochondria, with loss of cristae structures (B, C). The red “N” indicates nuclear pyknosis and dissolution (D–F). Large green curves indicate regular desmosomes (G), and the yellow “N” indicates regular nuclei in the ADSC group at 4 weeks post-irradiation (G–L). Blue arrows indicate mitochondria with few cristae (I). Small green curves indicate the endoplasmic reticulum (J). Yellow arrows indicate regularly shaped vascular endothelium (L)

