Figure 3.

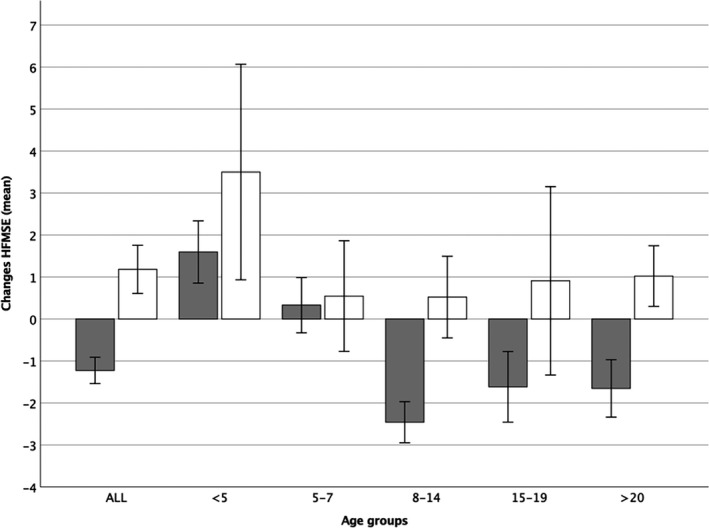
Mean 12‐months changes in external untreated controls and treated cohort. Color coding: dark grey: untreated controls, 22 white: treated cohort.

Mean 12‐months changes in external untreated controls and treated cohort. Color coding: dark grey: untreated controls, 22 white: treated cohort.