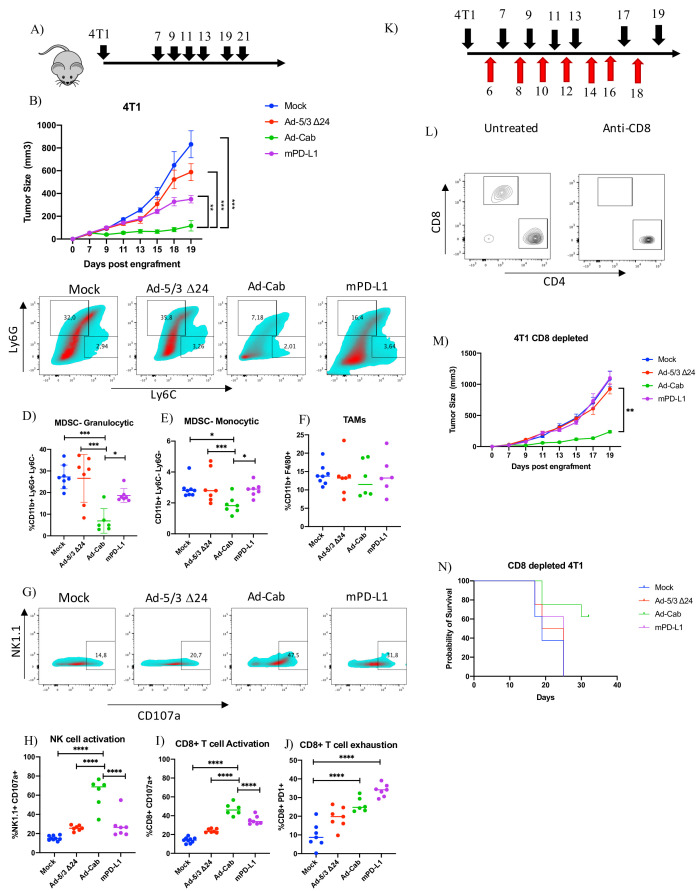
Figure 6.
Ad-Cab induces 4T1 tumor control in vivo in presence and absence of CD8+ T cells. (A) Schematic diagram of treatment schedule for 4T1 bearing mice. Mice were treated either with PBS (mock), Ad-5/3Δ24, Ad-Cab or mPD-L1 after 7 days postengraftment of 3×10⁵ cells in the right flank of the mice. Treatments were given on days 7, 9, 11, 13,17, 19 and 21. Ad-5/3Δ24 and Ad-Cab were given intratumorally at a dose of 1×10⁹ viral particles while 100 µg of mPD-L1 was given intraperitoneally. (B) Summary data for average tumor growth for all treatment groups for 4T1 tumor model. (C) Granulocytic (CD11b+Ly6 Ghi Ly6C-) and monocytic (CD11b+Ly6 Chi Ly6G-) MDSC infiltration in 4T1 tumor microenvironment. Cell percentages of granulocytic (D), monocytic (E) MDSC and TAM (F). NK cell activation (G, H) and CD8 (I) cell activation was determined using the CD107a degranulation marker. CD8+ T cell exhaustion was also measured using PD1 (J). (K) Schematic diagram of treatment (black arrows) and CD8 depletion (red arrows) schedule for 4T1 bearing mice. Treatment scheduled was the same as previously but 1 day before treatment 500 µg of CD8 depleting antibody was given and then every 2 days 100 µg was given. (L) CD8 and CD4 cell staining on CD3 gated peripheral blood from mice treated with or without depleting CD8 antibody. (M) Summary data for average tumor growth for all treatment groups for CD8 depleted 4T1 tumor model. (N) Kaplan-Meier survival curve for the treatment groups for CD8 depleted 4T1 bearing mice. MDSC, myeloid-derived suppressor cell; TAM, tumor-associated macrophage.

