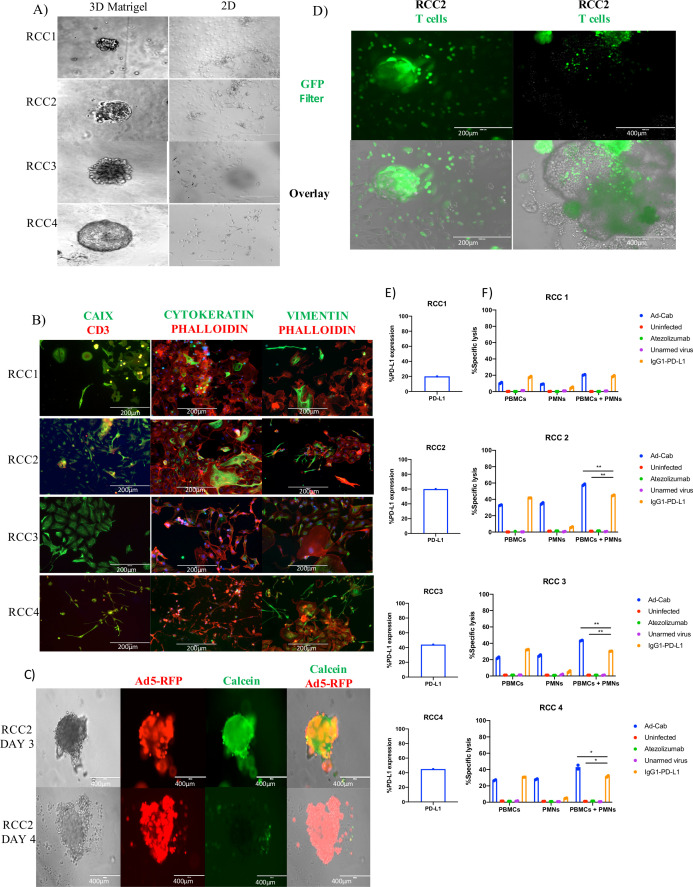
Figure 7.
Characterization of Ad-Cab in RCC patient-derived organoids. (A) Representative imaging of renal cancer cell tissue grown in Matrigel as 3D (left) and 2D (right). Immunofluorescence staining of dissociated RCC PDOs using CAIX, Cytokeratin, Vimentin, CD3 and Phalloidin. Scale bar 500 or 200 µm. (C) RCC2 PDOs were infected with 5×10⁵ vp of Ad5-RFP Δ24. Cell viability was visualized using Calcein green. Scale bars 200 µm. (D) Images of RCC2 PDOs infiltrated by Calcein green stained PBMCs. 105 PBMCs, stained with Calcein green, were added on top of Matrigel and after 4 hours images were taken using an EVOS FL cell imaging system. Scale bars 400 or 200 µm. (E) FACS analysis of PD-L1 expression of dissociated RCC PDOs. (F) ADCC assays with RCC1, RCC2, RCC3 and RCC4 PDOs. RCC PDOs were infected with viruses at 100 MOI and incubated for 48 hours or 10 µg/mL of antibody were added 30 min prior to adding immune components. PBMCs and PMNs were added at an E:T ratio of 40:1 and 100:1, respectively. LDH release assays were performed 4 hours after addition of immune effector cells. ADCC, antibody-dependent cell cytotoxicity; PBMC, peripheral blood mononuclear cell; PDO, patient-derived organoid; PMN, polymorphonuclear; RCC, renal cell carcinoma.

