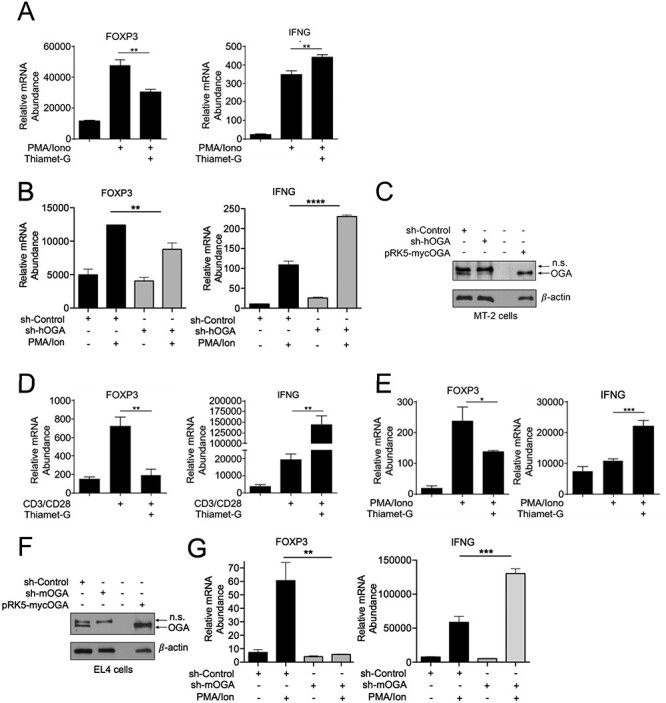
Fig. 1.

Increased O-GlcNAcylation reduces FOXP3 expression, (A) MT-2 cells (3 × 10⁶) were treated with 50 μM Thiamet-G overnight in 6 cm plates and stimulated with 50 ng/mL PMA and 250 ng/mL Ionomycin for additional 18 h. Samples were then analyzed by qPCR to determine the abundance of indicated mRNAs relative to that of TFR. (B) MT-2 (3.0 × 10⁶) were infected with lentivirus encoding human or mouse shOGA, respectively, or the control virus. Transduced cells were selected with 2 μg/mL puromycin for 48 h and then treated and gene expression was studied as in (A). (C) Suppression of O-GlcNAcase in MT-2 cells analyzed via western blotting. Transiently overexpressed OGA in HEK 293 T cells was used as a positive control to authenticate anti-OGA antibody and OGA detection. (D) EL4 thymoma cells (1 × 10⁶) were treated with 50 μM Thiamet-G overnight in 6-well plates either uncoated or coated with 2 μg/mL anti-CD3 and anti-CD28 antibodies for 8 h. (E) EL4 thymoma cells were treated as in (D) and stimulated with 50 ng/mL PMA and 250 ng/mL Ionomycin for 18 h. (F–G) EL4 cells (3.0x10⁶) were transduced with shOGA or control virus as in (B). (F) Suppression of OGA was assessed by western blotting. Transiently overexpressed OGA in HEK 293 T cells was used as a positive control to authenticate anti-OGA antibody and OGA detection. (G) Transduced EL4 thymoma cells were treated as in (E). (D, E, G) Samples were analyzed by qPCR to determine the abundance of indicated mRNAs relative to that of Ubiquitin Conjugating Enzyme E2 D2 (UBE2D2). Data are representative of three independent experiments, each performed in triplicates, presented as mean ± standard error of mean (SEM) (n = 3). P values were obtained by unpaired student t-test; **** P < 0.0001, *** P < 0.001, *#x002A; P < 0.01 and * P < 0.05.
