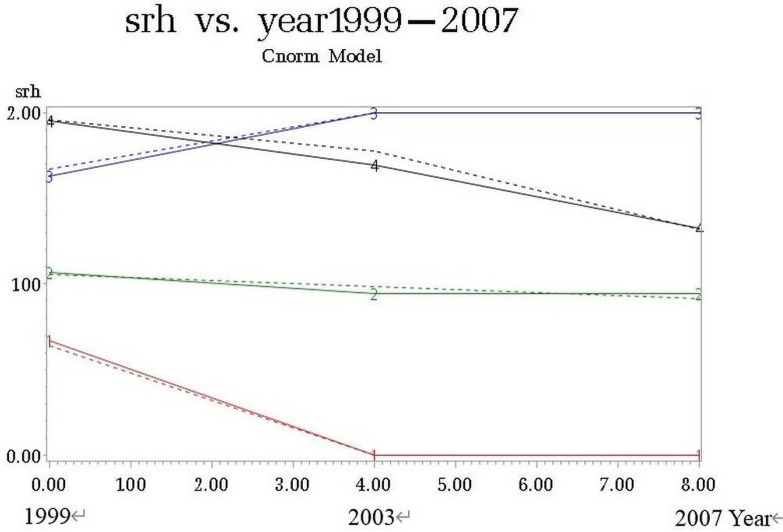
Figure 2.
Trajectories of SRH score between 1999 and 2007. After group-based trajectory analysis, there were 232 participants (11.9%, group 1) in the constant poor SRH group, 1123 participants (57.4%, group 2) in the constant fair SRH group, 335 participants (17.1%, group 3) in the constant good SRH group and 266 participants (13.6%, group 4) in the good-to-fair SRH group. SRH, self-rated health.

