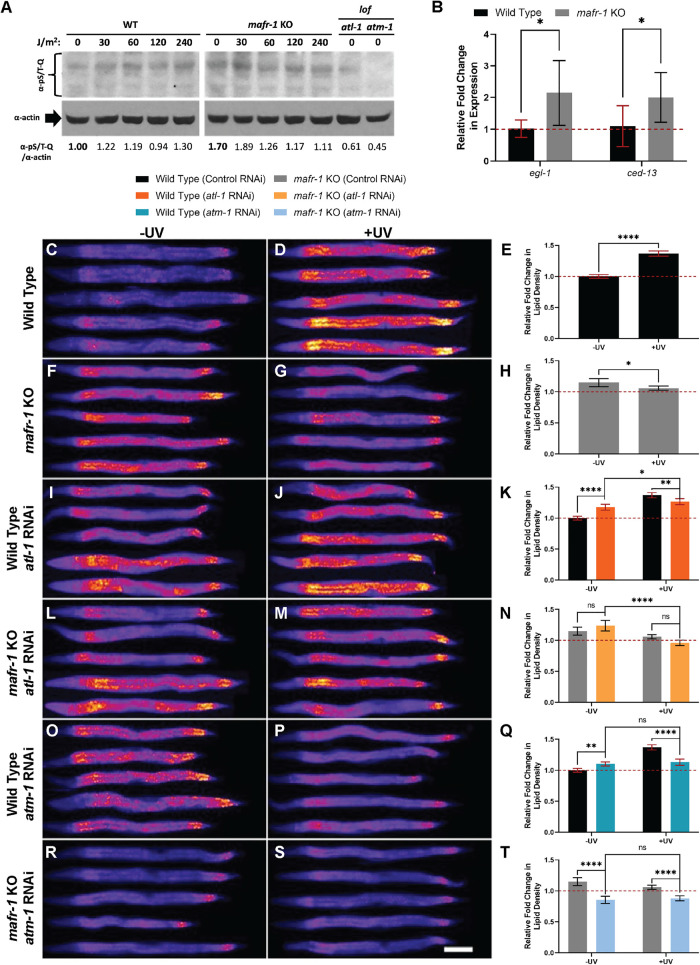
FIGURE 3:
mafr-1 intersects with the DDR pathway to mediate lipid abundance in response to UV phototoxicity. (A) mafr-1 KO animals activate ATL-1/ATM-1 target phosphorylation in response to UV light. (B) Expression of egl-1 and ced-13 is elevated in mafr-1 KO animals relative to WT. (C-D, F-G, I-J, L-M, O-P, R-S) Images of WT and mafr-1 KO animals treated with RNAi against atl-1 and atm-1 and stained with Nile Red after exposure to 30 J/m2 UV light. White scale bar is 100 μm. (E, H, K, N, Q, T) Quantification of Nile Red staining. Red dashed line shows the mean lipid density of untreated, WT animals. Student’s t test was used to determine the significance of egl-1 and ced-13 expression. A one-way ANOVA test with Tukey’s post hoc test was used for multiple sample comparisons in lipid density data. See Descriptive Statistics Table for sample sizes used in each experiment. *, p < 0.05; **, p < 0.01; ****, p < 0.0001; n.s., no significance. Error bars show 95% C.I. of the mean.

