FIGURE 1:

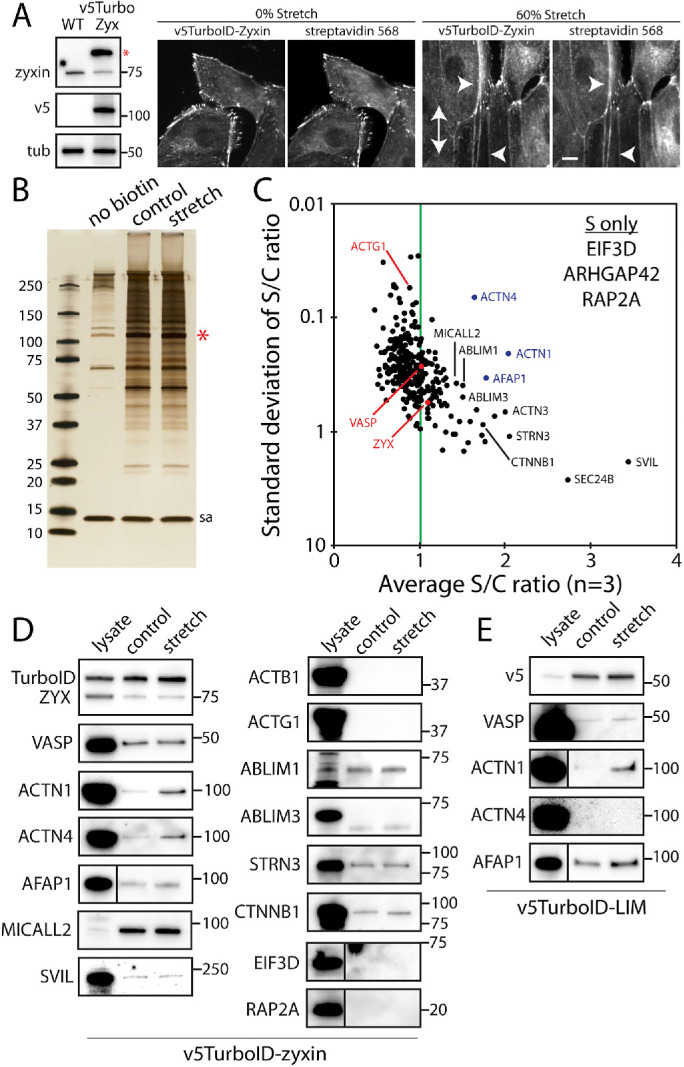
Stretch-dependent proximal biotinylation analysis using TurboID-tagged zyxin. (A) Characterization of MDCK cells stably expressing v5-TurboID-tagged zyxin using Western blot analysis (left) and immunofluorescent labeling (right). Tubulin (tub) was used as a loading control. The double-headed arrow indicates the stretch direction, and arrowheads indicate the zyxin positive fibers with streptavidin labeling. Scale bar, 10 μm. (B) Silver-stained SDS–PAGE analysis of purified biotinylated proteins from no biotin, control and stretch conditions. The red star indicates a band for self-biotinylated TurboID-tagged zyxin, and sa denotes streptavidin bands. (C) Mass spectrometry analysis of TurboID-tagged zyxin. The average and SD of ratios of sum intensities from control and stretch samples are plotted (n = 3). The green line indicates an equal level of biotinylation in control and stretch samples. Only top 320 hits based on the sum intensity (>107) were plotted. Top hits present in stretch condition only (S only) are also listed. (D) Western blot analysis of biotinylated proteins with control lysates as positive controls. (E) Western blot analysis of biotinylated proteins from TurboID-tagged LIM domain of zyxin.
