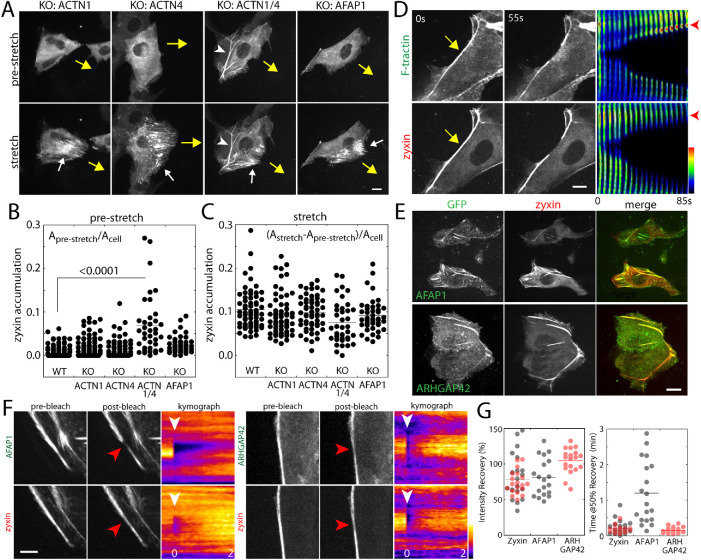
FIGURE 3:
Force-induced zyxin accumulation is independent of α-actinin and AFAP1. (A) Stretch-induced accumulation of zyxin in α-actinin and AFAP1 knockout cell lines. Yellow arrows indicate the movement of microneedle and white arrows indicate the zyxin accumulation. White arrows indicate zyxin accumulation on actin fibers under tension. The white arrowhead indicates zyxin-positive fibers in α-actinin 1/4 double knockout cells. Scale bar, 10 μm. (B) Quantification of zyxin accumulation in prestretch cells. Zyxin accumulation was quantified using the thresholded area based on zyxin intensity and was normalized to total cell area. (C) Under force-bearing conditions, zyxin accumulation was quantified using the difference of the thresholded area of zyxin intensity in prestretch and stretch cells, and then the value was normalized to cell area. N = 63 (WT), 58 (KO: ACTN1), 54 (KO: ACTN4), 38 (KO: ACTN1/4), and 41 (KO: AFAP1). The p value is calculated using one-way ANOVA. (D) Severing the actin fibers in actinin 1/4 deficient cells using a microneedle. Using a microneedle to gently touch and sever actin fibers at the cell edge (yellow arrow), the fate of actin fibers was monitored as the montages of F-tractin and zyxin intensity profiles along actin fibers (right panel). Scale bar, 5 μm. (E) AFAP1 and ARHGAP42 colocalize with zyxin-positive actin fibers in α-actinin 1- and 4-deficient cells. Scale bar, 10 μm. (F) Turnover of AFAP1 and ARHGAP42 analyzed by fluorescence recovery after photobleaching (FRAP). The α-actinin 1- and 4-deficient cells transfected with zyxin-tdDsRed and GFP-tagged AFAP1 or ARHGAP42. A small region of fiber was photobleached (see red and white arrowheads) and the intensity recovery was monitored over time. The intensity line scan along the fiber was used to generate kymograph of the intensity recovery. Scale bar, 5 μm. (G) The intensity recovery curve was characterized based on the percentage of intensity recovery over the prebleached intensity during the first 5 min and the time it took to recover 50% of the initial intensity. Gray circles represent the analysis of AFAP1 and zyxin coexpressing cells and red circles represent the analysis of ARHGAP42 and zyxin coexpressing cells.

