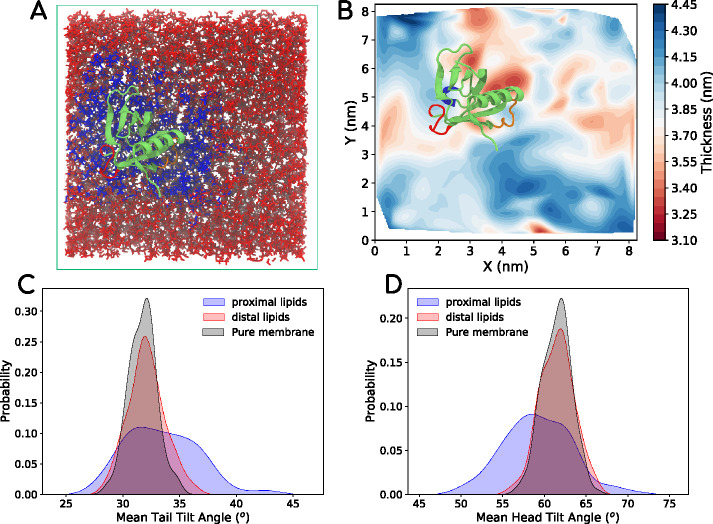
FIGURE 3:
(A) Snapshot from an all-atom DOPC-DOPS-PIP2 bilayer system with a single PHD (shown in light green) on the leaflet at the top. The lipids proximal to the protein are marked in blue. The distal lipids are marked in red. The lipids were tracked for 500 ns for the analysis. (B) Thickness profile of the bilayer with the PHD, showing thinner regions in red and thicker regions in blue. (C) Average tail angle distribution of lipids proximal to the protein (blue), distal to the protein (red), and in pure bilayer with no proteins (black). (D) Average head angle distribution of lipids. In Supplemental Figure S2, we provide some more data with thickness profiles of replicates and visuals of lipid conformations near and far away from the PHD.

