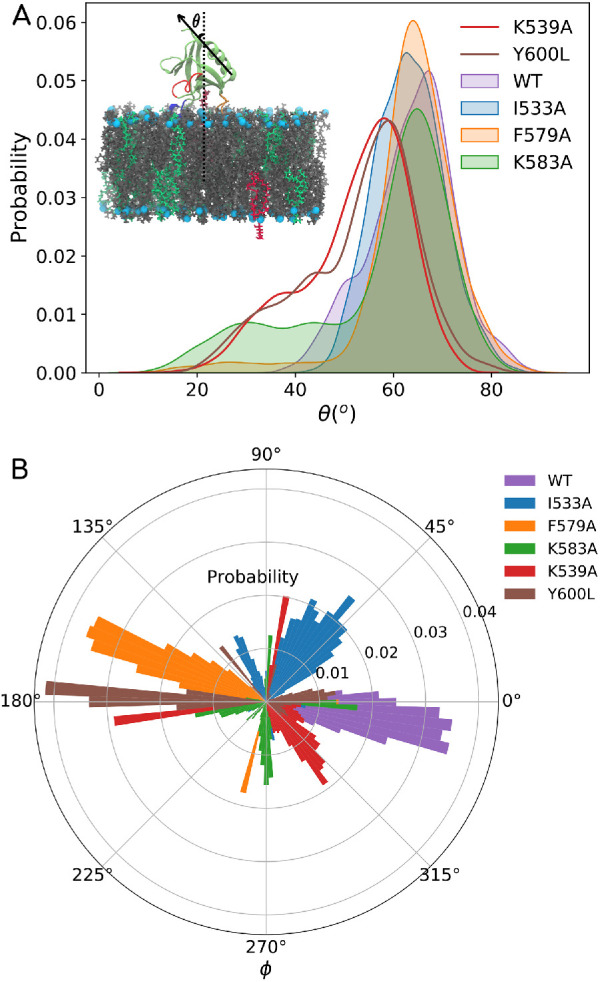
FIGURE 7:

Data showing orientation distribution for PHD for WT and various mutant systems. (A) Inset in the top panel shows a schematic where θ is the angle that the helical axis makes with the membrane normal. θ angle distributions for the WT, I533A, F579A, K583A, Y600L, and K539A systems are shown in the top panel. (B) φ is the angle that the helical axis makes with a reference axis on the plane of the membrane and is shown in the bottom panel for all the WT and mutant systems.
