FIGURE 1:
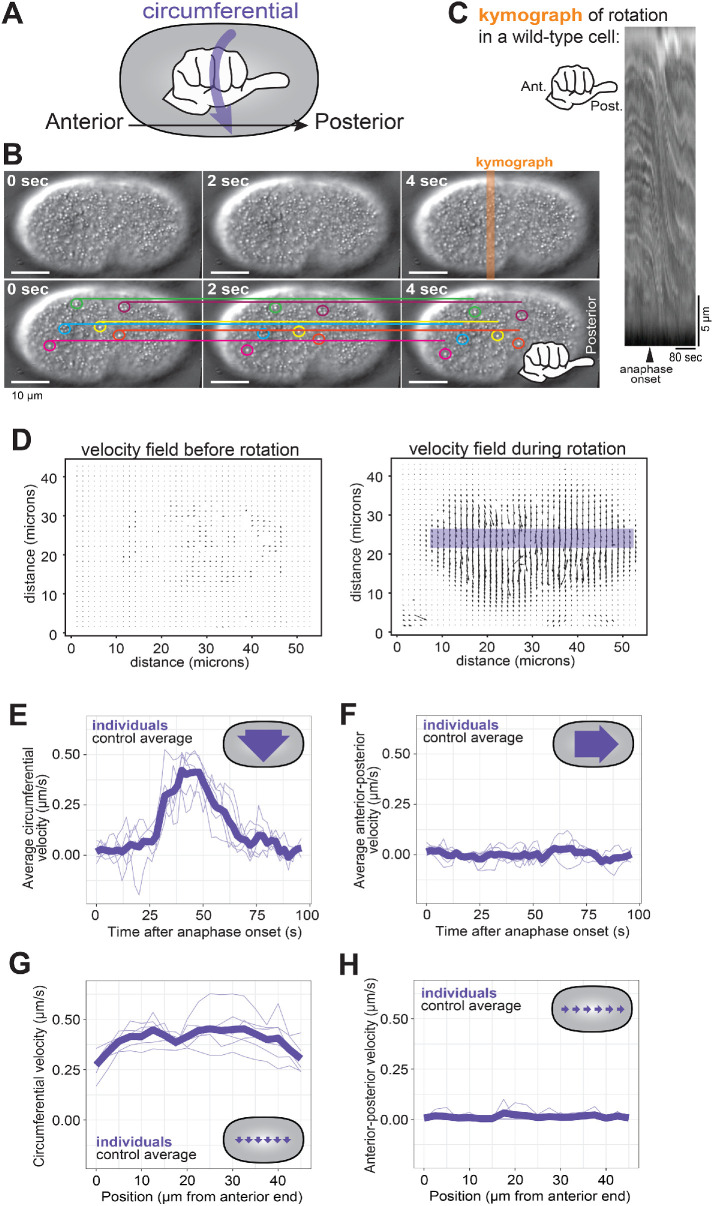
Cortical rotation in C. elegans. (A) Schematic depiction of the use of a hand with thumb pointed toward the zygote posterior to determine the chirality of C. elegans cortical rotation. (B) Consecutive frames of cortical rotation (dt = 2 s). Colored circles highlight cortical granules, while the corresponding colored line denotes the starting location (at t = 0 s) of the granule across all time points. Scale bar = 10 microns. (C) Kymograph of cortical rotation in a control cell. (D) Representative vector field outputs from OpenPIV using the same cell as in A before and during rotation. Arrow length represents local velocity. (E, F) Circumferential (around the anterior–posterior axis) and posterior-directed velocities during cortical rotation over time, averaged across the length of the cell. (G, H) Averaged circumferential velocity of cortical rotation with respect to the position along the anterior–posterior axis. Pale purple lines are individuals; heavy purple line is the population average (n = 6).

