FIGURE 2:
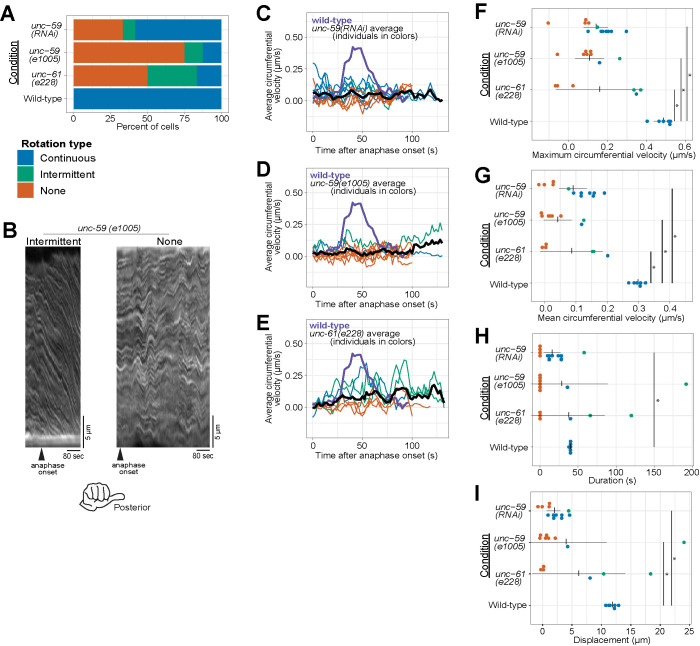
Cortical rotation is dependent on septins. (A) Rotation phenotype frequency for genetic perturbations of septins. Continuous rotation has a single period of increased velocity; intermittent rotation has several periods interspersed with periods of slower or no movement; none indicates that no rotation occurred. (B) Example kymographs of cells exhibiting intermittent or no rotation (see Figure 1 for continuous rotation). (C–E) Circumferential velocities over time averaged across the anterior–posterior axis. Colored lines indicate individuals of the corresponding color-coded phenotype; black line is the population average (unc-59(RNAi) n = 12; unc-59(e1005) n = 9; unc-61(e228) n = 6); purple line is the control average (n = 6). (F–I) Quantification of mean velocity, maximum velocity, duration, and displacement, respectively. Colored dots are individuals of the corresponding phenotype. Vertical notches are population means; horizontal lines are 95% confidence intervals. *p < 0.05; unmarked pairings are not significantly different.

