FIGURE 1:
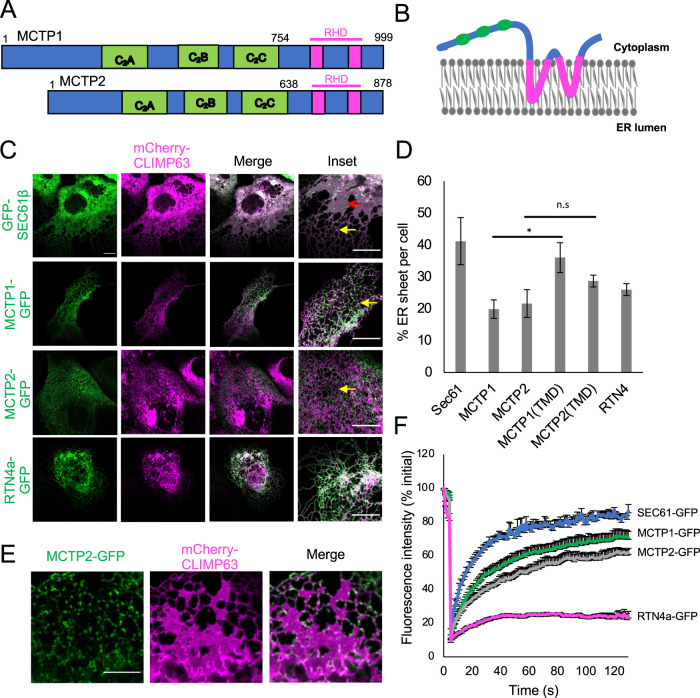
MCTP1 and MCTP2 are ER membrane tubulating proteins. (A) Domains in MCTP1 and MCTP2. The green blocks represent the three C2 domains, whereas the magenta blocks are the TMDs, which are similar to RHDs. (B) Predicted topology of MCTPs. Both N- and C-terminus are in the cytoplasm. The two inverted hairpins in the outer leaflet of the ER membrane are the TMDs, which are like RHDs. (C) Confocal images of live COS-7 cells expressing mCherry-CLIMP63 with GFP-SEC61β, MCTP1-GFP, MCTP2-GFP, or RTN4a-GFP. Red arrows indicate ER sheet, whereas yellow arrows indicate ER tubules. Scale bar, 10 µm. (D) Quantification of percent ER sheet per cell. Error bars indicate mean ± SE, n = 7–10 cells/condition, *p < 0.05, n.s, not significant, Student’s t test. (E) Airyscan images of live COS-7 cells expressing mCherry-CLIMP63 and MCTP2-GFP. Scale bar, 5 µm. (F) Mean fluorescence intensities normalized to initial value plotted over time of FRAP analysis on MCTP1-GFP, MCTP2-GFP, GFP-SEC61β, and RTN4a-GFP. Error bars indicate ± SE, n = 10 cells.

