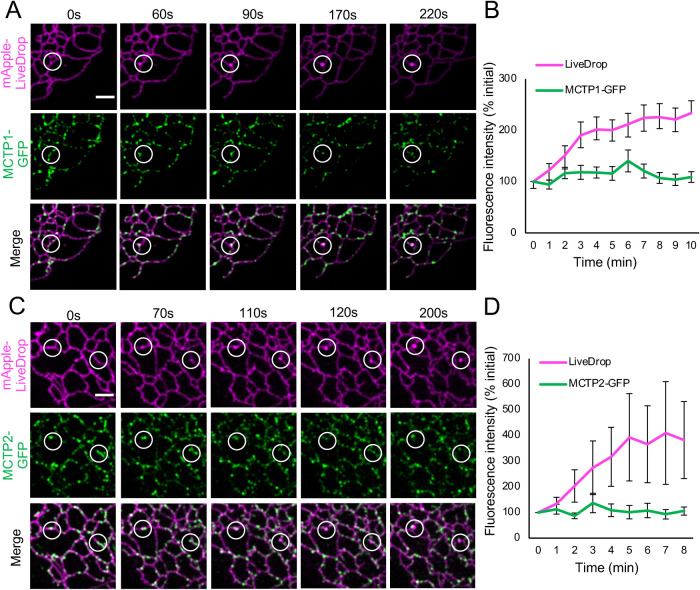
FIGURE 2:
Nascent LDs form at ER subdomains containing MCTPs. (A, C) Airyscan images of live COS-7 cells expressing mApple-LiveDrop together with MCTP1-GFP or MCTP2-GFP. White circles indicate sites of nascent LD formation. Cells were incubated in starvation medium for 16–20 h. Images were taken immediately after addition of 400 µM OA at the interval of 5 s for at least 10 min. Scale bar, 2 µm. (B, D) Quantification of fluorescence intensity of mApple-LiveDrop and MCTP1-GFP or MCTP2-GFP at 25–30 sites of new LD formation from three independent experiments. Error bars indicate mean ± SE.

