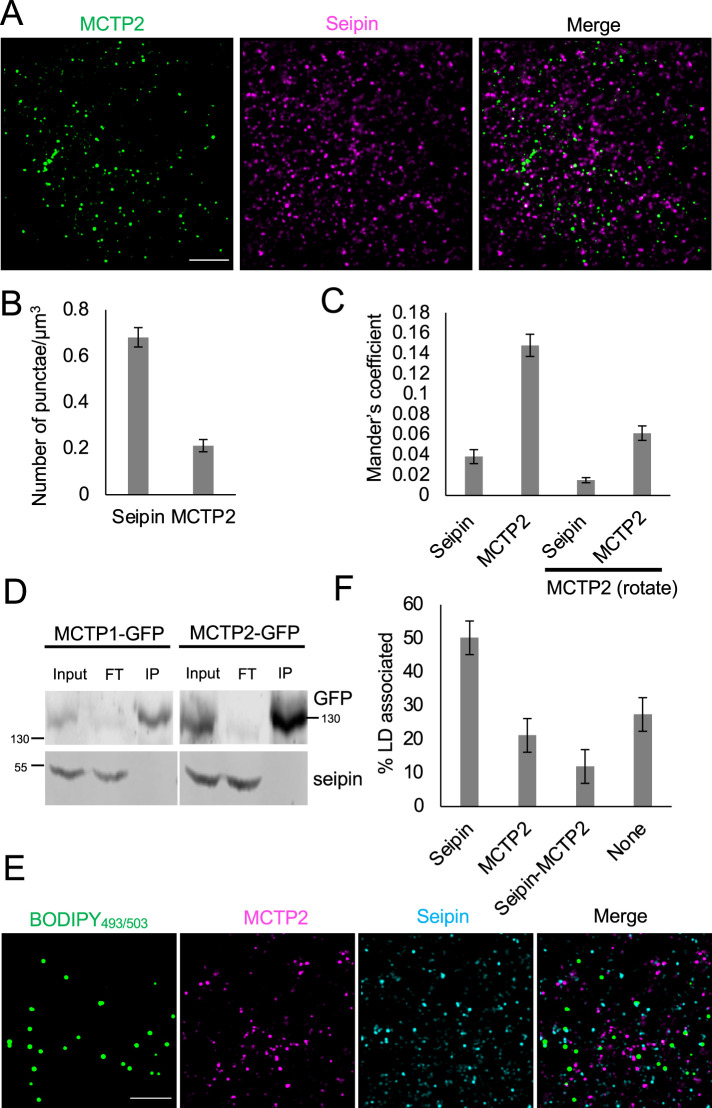
FIGURE 3:
MCTP2 is associated with a subpopulation of LDs. (A) Airyscan images of a fixed cell stained for endogenous MCTP2 and seipin. Scale bar, 5 µm. (B) Quantification of number of MCTP2 and seipin punctae shown in A. Error bars indicate mean ± SE, n = 17 fields of view from 17 cells. (C) Quantification of colocalization of seipin and MCTP2 punctae by Mander’s colocalization coefficient. Error bars indicate mean ± SE, n = 17 fields of view from 17 cells. (D) Immunoblots of anti-GFP immunoprecipitates from COS-7 cells expressing either MCTP1-GFP or MCTP2-GFP. FT, flowthrough; IP, immuno-pulldown. (E) Airyscan images of fixed cells stained for MCTP2 and seipin. LDs were labeled with BODIPY493/503 Scale bar, 5 µm. (F) Quantification of the percent of LDs associated with seipin, MCTP2, seipin and MCTP2, or none. Error bars indicate mean ± SE, n = 15 fields of view from 15 cells.

