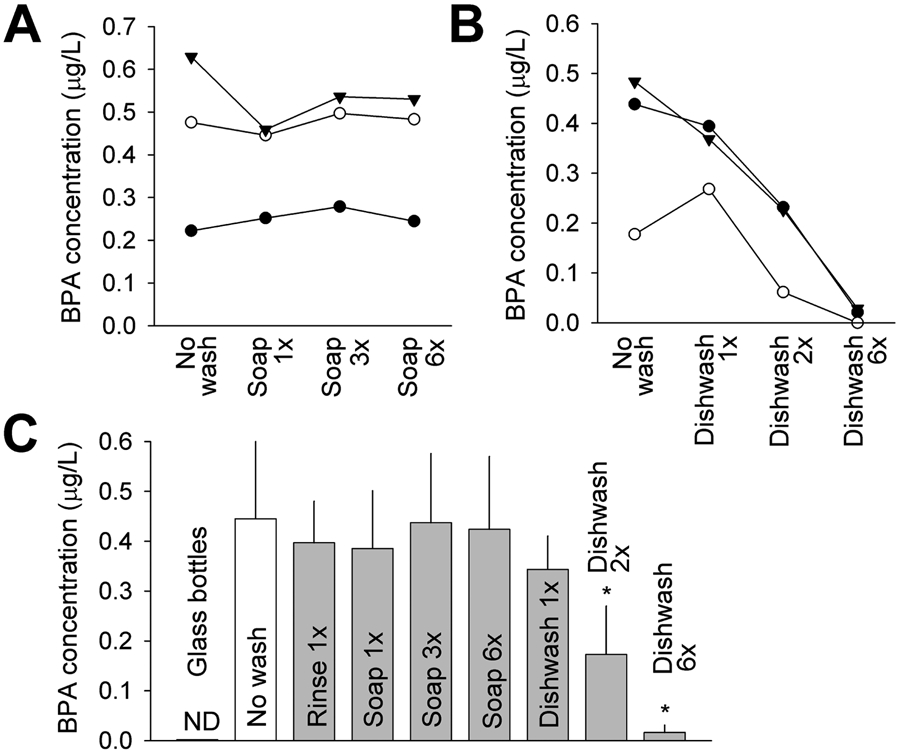
Figure 2.

(A) BPA concentration in water samples from 3 individual Tritan water bottles before wash and after 1x, 3x and 6x total rounds of handwashing with soap and water. (B) BPA concentration in water samples from another 3 individual Tritan water bottles before wash and after 1x, 2x and 6x total rounds of dishwashing. (C) Average BPA concentration in water samples in unwashed and various washing groups. N = 9 for the unwashed group and 3 for all other groups. *, P < 0.05 in a paired t-test vs no wash group. ND, not detected. Error bars are S.D.
