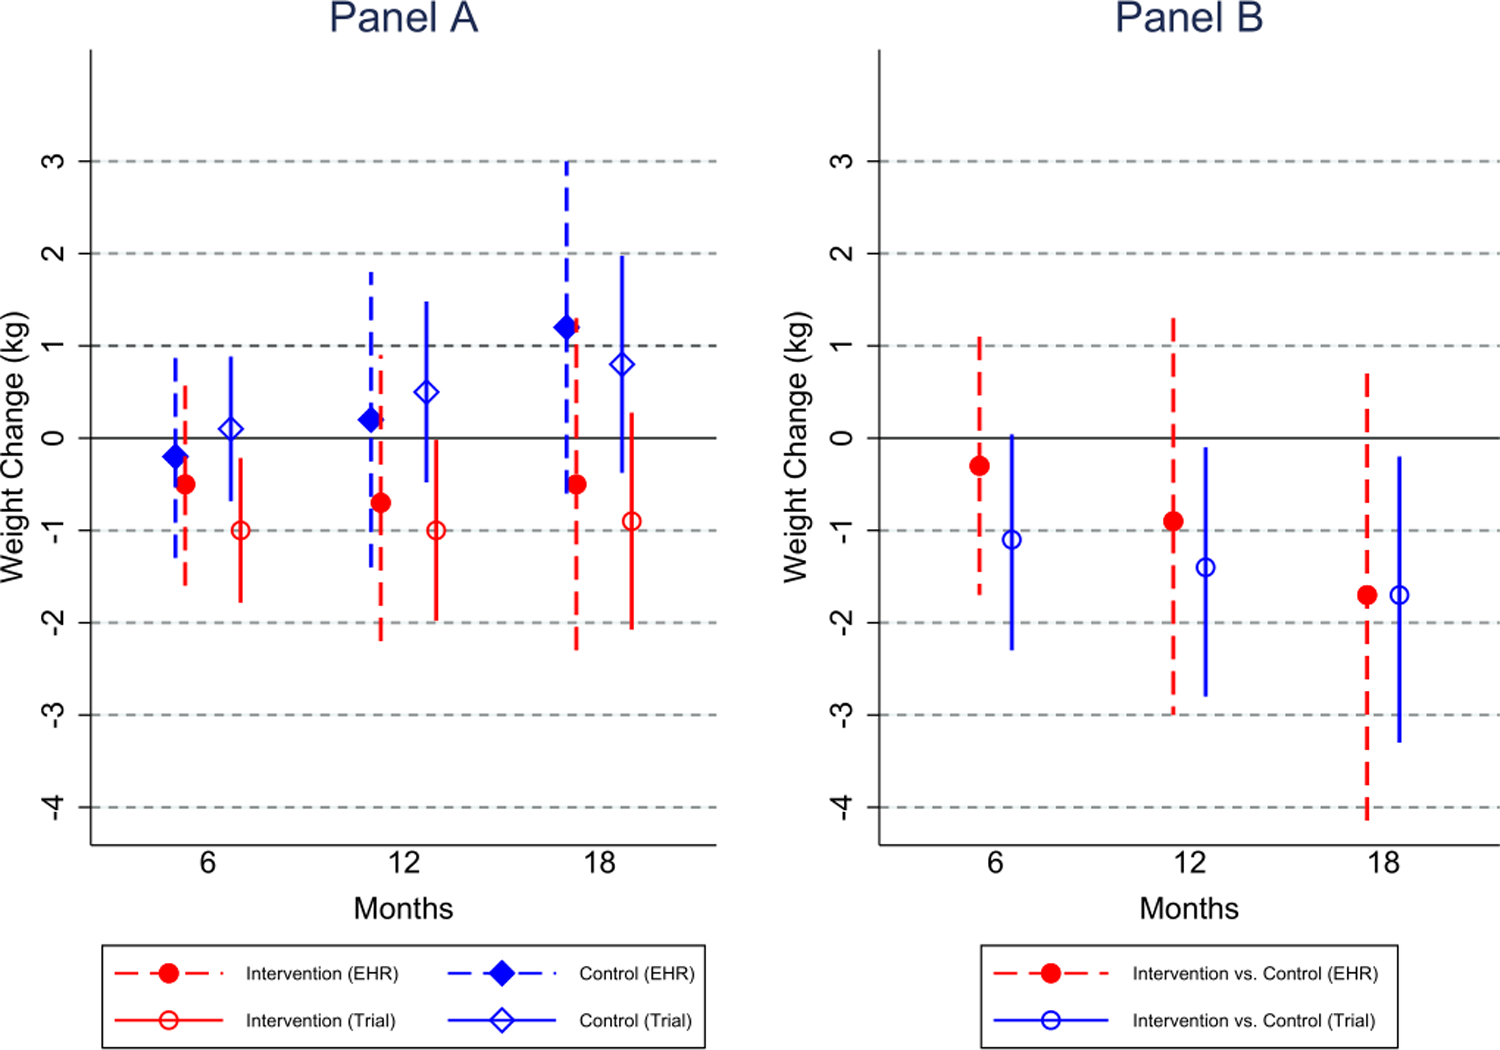
Figure 2. Comparison of EHR data and trial data estimated mean weight loss and intervention effect from the Shape Trial.

Panel A shows the estimated mean weight change separately in intervention and control, for the original Shape trial data and the EHR data separately. Panel B displays the difference in weight change between intervention and control, estimating using separate mixed effects models for the original trial data (extracted from the Shape main results paper) and the EHR data.
