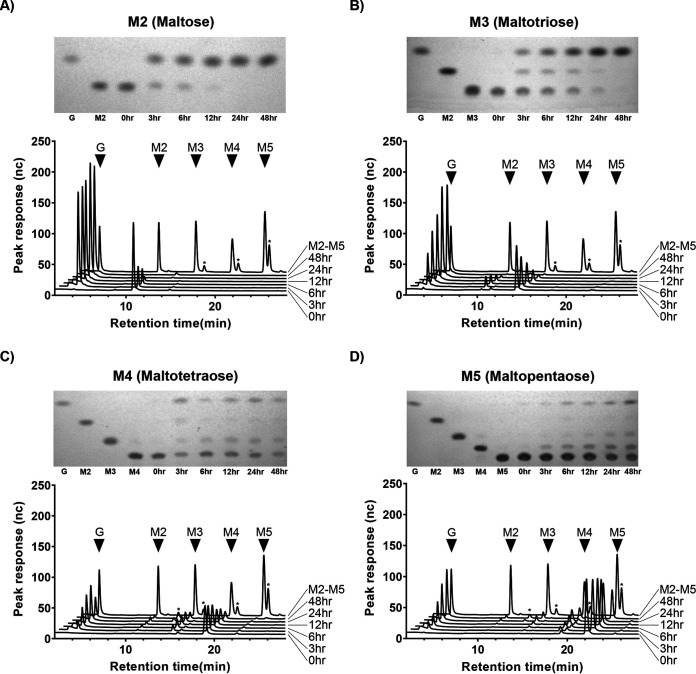
FIG 5.
α-Glucosidase CG400_06090 digests of maltose to maltopentaose. Each panel shows a TLC plate and HPAEC-PAD trace of CG400_06090 digests of M2 to M5 between 0 h and 48 h. Major peaks from M2 to M5 standards are indicated with black triangles, while asterisks represent unique, undefined oligosaccharides.

