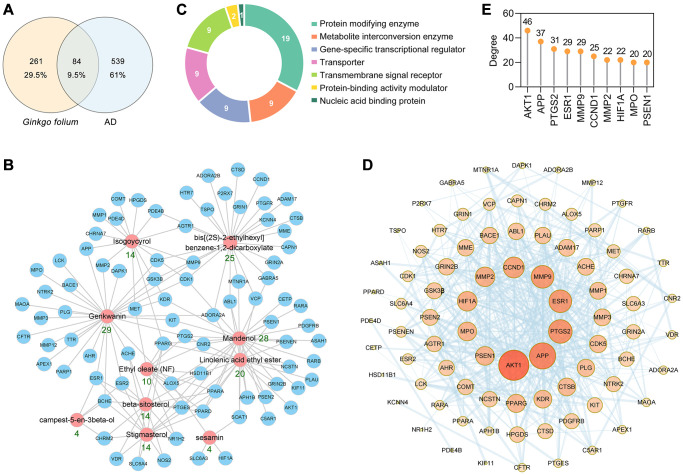
Figure 2.
PPI network construction for the target proteins of GF against AD. (A) The intersection of GF and AD targets. (B) The main active ingredients-AD target network diagram of GF against AD. The active ingredients nodes are colored in red, and blue nodes represent target proteins. (C) Panther classification categorized target proteins of GF against AD. (D) PPI network of GF against AD. Nodes, targets; edges, interaction among targets. The darker the color and the larger the node, the higher the degree. The thickness of the edges represents the combined score. (E) The top 10 core targets were excavated according to the degree. The numbers above the dots represent degree.

